00007983542020FYfalseus-gaap:AccountingStandardsUpdate201613MemberP10YP4YP8YP3YP1YP1YP1YP1Yus-gaap:AccountsPayableAndAccruedLiabilitiesCurrentus-gaap:AccountsPayableAndAccruedLiabilitiesCurrentus-gaap:OtherLiabilitiesNoncurrentus-gaap:OtherLiabilitiesNoncurrentus-gaap:LongTermDebtAndCapitalLeaseObligationsus-gaap:LongTermDebtAndCapitalLeaseObligationsus-gaap:Revenuesus-gaap:Revenuesus-gaap:Revenuesus-gaap:Revenuesus-gaap:OtherAssetsNoncurrentus-gaap:OtherAssetsNoncurrentus-gaap:PropertyPlantAndEquipmentAndFinanceLeaseRightOfUseAssetAfterAccumulatedDepreciationAndAmortizationus-gaap:PropertyPlantAndEquipmentAndFinanceLeaseRightOfUseAssetAfterAccumulatedDepreciationAndAmortizationus-gaap:LongTermDebtAndCapitalLeaseObligationsCurrentus-gaap:LongTermDebtAndCapitalLeaseObligationsCurrent3.544.5P3YP3YP3Y00007983542020-01-012020-12-310000798354us-gaap:CommonStockMember2020-01-012020-12-310000798354fisv:SeniorNotesDue2023Member2020-01-012020-12-310000798354fisv:SeniorNotesDue2027Member2020-01-012020-12-310000798354fisv:SeniorNotesDue2030Member2020-01-012020-12-310000798354fisv:SeniorNotesDue2025Member2020-01-012020-12-310000798354fisv:SeniorNotesDue2031Member2020-01-012020-12-31iso4217:USD00007983542020-06-30xbrli:shares00007983542021-02-190000798354fisv:ProcessingAndServicesMember2020-01-012020-12-310000798354fisv:ProcessingAndServicesMember2019-01-012019-12-310000798354fisv:ProcessingAndServicesMember2018-01-012018-12-310000798354us-gaap:ProductMember2020-01-012020-12-310000798354us-gaap:ProductMember2019-01-012019-12-310000798354us-gaap:ProductMember2018-01-012018-12-3100007983542019-01-012019-12-3100007983542018-01-012018-12-31iso4217:USDxbrli:shares0000798354fisv:RelatedPartyFeesMemberus-gaap:EquityMethodInvesteeMember2020-01-012020-12-310000798354fisv:RelatedPartyFeesMemberus-gaap:EquityMethodInvesteeMember2019-01-012019-12-310000798354fisv:RelatedPartyFeesMemberus-gaap:EquityMethodInvesteeMember2018-01-012018-12-310000798354fisv:CostOfServicesMember2020-01-012020-12-310000798354fisv:CostOfServicesMember2019-01-012019-12-310000798354fisv:CostOfServicesMember2018-01-012018-12-310000798354us-gaap:InterestExpenseMember2020-01-012020-12-310000798354us-gaap:InterestExpenseMember2019-01-012019-12-310000798354us-gaap:InterestExpenseMember2018-01-012018-12-3100007983542020-12-3100007983542019-12-310000798354us-gaap:CustomerRelatedIntangibleAssetsMember2020-12-310000798354us-gaap:CustomerRelatedIntangibleAssetsMember2019-12-310000798354us-gaap:OtherIntangibleAssetsMember2020-12-310000798354us-gaap:OtherIntangibleAssetsMember2019-12-310000798354us-gaap:CommonStockMember2017-12-310000798354us-gaap:TreasuryStockMember2017-12-310000798354us-gaap:AdditionalPaidInCapitalMember2017-12-310000798354us-gaap:AccumulatedOtherComprehensiveIncomeMember2017-12-310000798354us-gaap:RetainedEarningsMember2017-12-310000798354us-gaap:NoncontrollingInterestMember2017-12-3100007983542017-12-310000798354us-gaap:RetainedEarningsMember2018-01-012018-12-310000798354us-gaap:AccumulatedOtherComprehensiveIncomeMember2018-01-012018-12-310000798354us-gaap:AdditionalPaidInCapitalMember2018-01-012018-12-310000798354us-gaap:TreasuryStockMember2018-01-012018-12-310000798354srt:CumulativeEffectPeriodOfAdoptionAdjustmentMemberus-gaap:RetainedEarningsMemberus-gaap:AccountingStandardsUpdate201409Member2017-12-310000798354srt:CumulativeEffectPeriodOfAdoptionAdjustmentMemberus-gaap:AccountingStandardsUpdate201409Member2017-12-310000798354srt:CumulativeEffectPeriodOfAdoptionAdjustmentMemberus-gaap:AccountingStandardsUpdate201712Memberus-gaap:AccumulatedOtherComprehensiveIncomeMember2017-12-310000798354srt:CumulativeEffectPeriodOfAdoptionAdjustmentMemberus-gaap:AccountingStandardsUpdate201712Memberus-gaap:RetainedEarningsMember2017-12-310000798354srt:CumulativeEffectPeriodOfAdoptionAdjustmentMemberus-gaap:AccountingStandardsUpdate201712Member2017-12-310000798354srt:CumulativeEffectPeriodOfAdoptionAdjustmentMemberus-gaap:AccountingStandardsUpdate201802Memberus-gaap:AccumulatedOtherComprehensiveIncomeMember2017-12-310000798354srt:CumulativeEffectPeriodOfAdoptionAdjustmentMemberus-gaap:RetainedEarningsMemberus-gaap:AccountingStandardsUpdate201802Member2017-12-310000798354srt:CumulativeEffectPeriodOfAdoptionAdjustmentMemberus-gaap:AccountingStandardsUpdate201802Member2017-12-310000798354us-gaap:CommonStockMember2018-12-310000798354us-gaap:TreasuryStockMember2018-12-310000798354us-gaap:AdditionalPaidInCapitalMember2018-12-310000798354us-gaap:AccumulatedOtherComprehensiveIncomeMember2018-12-310000798354us-gaap:RetainedEarningsMember2018-12-310000798354us-gaap:NoncontrollingInterestMember2018-12-3100007983542018-12-310000798354us-gaap:RetainedEarningsMember2019-01-012019-12-310000798354us-gaap:NoncontrollingInterestMember2019-01-012019-12-310000798354us-gaap:TreasuryStockMember2019-01-012019-12-310000798354us-gaap:AdditionalPaidInCapitalMember2019-01-012019-12-310000798354us-gaap:AccumulatedOtherComprehensiveIncomeMember2019-01-012019-12-310000798354us-gaap:CommonStockMember2019-12-310000798354us-gaap:TreasuryStockMember2019-12-310000798354us-gaap:AdditionalPaidInCapitalMember2019-12-310000798354us-gaap:AccumulatedOtherComprehensiveIncomeMember2019-12-310000798354us-gaap:RetainedEarningsMember2019-12-310000798354us-gaap:NoncontrollingInterestMember2019-12-310000798354us-gaap:RetainedEarningsMember2020-01-012020-12-310000798354us-gaap:NoncontrollingInterestMember2020-01-012020-12-310000798354us-gaap:AdditionalPaidInCapitalMember2020-01-012020-12-310000798354us-gaap:AccumulatedOtherComprehensiveIncomeMember2020-01-012020-12-310000798354us-gaap:TreasuryStockMember2020-01-012020-12-310000798354us-gaap:CommonStockMember2020-01-012020-12-310000798354srt:CumulativeEffectPeriodOfAdoptionAdjustmentMemberus-gaap:RetainedEarningsMember2019-12-310000798354srt:CumulativeEffectPeriodOfAdoptionAdjustmentMember2019-12-310000798354us-gaap:CommonStockMember2020-12-310000798354us-gaap:TreasuryStockMember2020-12-310000798354us-gaap:AdditionalPaidInCapitalMember2020-12-310000798354us-gaap:AccumulatedOtherComprehensiveIncomeMember2020-12-310000798354us-gaap:RetainedEarningsMember2020-12-310000798354us-gaap:NoncontrollingInterestMember2020-12-310000798354fisv:BankOfAmericaMember2020-01-012020-12-31xbrli:pure0000798354fisv:FirstDataMember2019-07-290000798354fisv:FirstDataMember2019-07-292019-07-2900007983542018-02-212018-02-210000798354fisv:MerchantCreditLossesMember2020-01-012020-12-310000798354fisv:MerchantCreditLossesMember2019-01-012019-12-310000798354fisv:MerchantCreditLossesMember2020-12-310000798354fisv:MerchantCreditLossesMember2019-12-310000798354us-gaap:LandMember2020-12-310000798354us-gaap:LandMember2019-12-310000798354srt:MinimumMemberfisv:DataProcessingEquipmentMember2020-01-012020-12-310000798354srt:MaximumMemberfisv:DataProcessingEquipmentMember2020-01-012020-12-310000798354fisv:DataProcessingEquipmentMember2020-12-310000798354fisv:DataProcessingEquipmentMember2019-12-310000798354srt:MinimumMemberfisv:BuildingsAndLeaseholdImprovementsMember2020-01-012020-12-310000798354fisv:BuildingsAndLeaseholdImprovementsMembersrt:MaximumMember2020-01-012020-12-310000798354fisv:BuildingsAndLeaseholdImprovementsMember2020-12-310000798354fisv:BuildingsAndLeaseholdImprovementsMember2019-12-310000798354fisv:FurnitureAndEquipmentMembersrt:MinimumMember2020-01-012020-12-310000798354fisv:FurnitureAndEquipmentMembersrt:MaximumMember2020-01-012020-12-310000798354fisv:FurnitureAndEquipmentMember2020-12-310000798354fisv:FurnitureAndEquipmentMember2019-12-310000798354us-gaap:CustomerRelatedIntangibleAssetsMembersrt:MinimumMember2020-01-012020-12-310000798354us-gaap:CustomerRelatedIntangibleAssetsMembersrt:MaximumMember2020-01-012020-12-310000798354srt:MinimumMemberfisv:AcquiredSoftwareAndTechnologyMember2020-01-012020-12-310000798354fisv:AcquiredSoftwareAndTechnologyMembersrt:MaximumMember2020-01-012020-12-310000798354us-gaap:TradeNamesMembersrt:MinimumMember2020-01-012020-12-310000798354us-gaap:TradeNamesMembersrt:MaximumMember2020-01-012020-12-310000798354srt:MinimumMemberus-gaap:ComputerSoftwareIntangibleAssetMember2020-01-012020-12-310000798354us-gaap:ComputerSoftwareIntangibleAssetMembersrt:MaximumMember2020-01-012020-12-310000798354fisv:CapitalizedSoftwareDevelopmentCostsMember2020-01-012020-12-310000798354srt:MinimumMemberfisv:MerchantPortfoliosMember2020-01-012020-12-310000798354fisv:MerchantPortfoliosMembersrt:MaximumMember2020-01-012020-12-310000798354srt:CumulativeEffectPeriodOfAdoptionAdjustmentMemberus-gaap:RetainedEarningsMemberus-gaap:AccountingStandardsUpdate201613Member2019-12-310000798354us-gaap:AccountingStandardsUpdate201602Member2019-01-010000798354us-gaap:RevenueFromContractWithCustomerMemberus-gaap:NonUsMemberus-gaap:GeographicConcentrationRiskMember2020-01-012020-12-310000798354us-gaap:RevenueFromContractWithCustomerMemberus-gaap:NonUsMemberus-gaap:GeographicConcentrationRiskMember2019-01-012019-12-310000798354us-gaap:RevenueFromContractWithCustomerMemberus-gaap:NonUsMemberus-gaap:GeographicConcentrationRiskMember2018-01-012018-12-310000798354us-gaap:OperatingSegmentsMemberfisv:AcceptanceSegmentMemberfisv:ProcessingMember2020-01-012020-12-310000798354us-gaap:OperatingSegmentsMemberfisv:FintechSegmentMemberfisv:ProcessingMember2020-01-012020-12-310000798354fisv:PaymentsAndIndustryProductsSegmentMemberus-gaap:OperatingSegmentsMemberfisv:ProcessingMember2020-01-012020-12-310000798354fisv:CorporateReconcilingItemsAndEliminationsMemberfisv:ProcessingMember2020-01-012020-12-310000798354fisv:ProcessingMember2020-01-012020-12-310000798354us-gaap:OperatingSegmentsMemberfisv:AcceptanceSegmentMemberfisv:HardwarePrintAndCardProductionMember2020-01-012020-12-310000798354us-gaap:OperatingSegmentsMemberfisv:FintechSegmentMemberfisv:HardwarePrintAndCardProductionMember2020-01-012020-12-310000798354fisv:PaymentsAndIndustryProductsSegmentMemberus-gaap:OperatingSegmentsMemberfisv:HardwarePrintAndCardProductionMember2020-01-012020-12-310000798354fisv:HardwarePrintAndCardProductionMemberfisv:CorporateReconcilingItemsAndEliminationsMember2020-01-012020-12-310000798354fisv:HardwarePrintAndCardProductionMember2020-01-012020-12-310000798354us-gaap:OperatingSegmentsMemberfisv:ProfessionalServicesMemberfisv:AcceptanceSegmentMember2020-01-012020-12-310000798354us-gaap:OperatingSegmentsMemberfisv:FintechSegmentMemberfisv:ProfessionalServicesMember2020-01-012020-12-310000798354fisv:PaymentsAndIndustryProductsSegmentMemberus-gaap:OperatingSegmentsMemberfisv:ProfessionalServicesMember2020-01-012020-12-310000798354fisv:ProfessionalServicesMemberfisv:CorporateReconcilingItemsAndEliminationsMember2020-01-012020-12-310000798354fisv:ProfessionalServicesMember2020-01-012020-12-310000798354us-gaap:OperatingSegmentsMemberfisv:SoftwareMaintenanceMemberfisv:AcceptanceSegmentMember2020-01-012020-12-310000798354us-gaap:OperatingSegmentsMemberfisv:FintechSegmentMemberfisv:SoftwareMaintenanceMember2020-01-012020-12-310000798354fisv:PaymentsAndIndustryProductsSegmentMemberus-gaap:OperatingSegmentsMemberfisv:SoftwareMaintenanceMember2020-01-012020-12-310000798354fisv:SoftwareMaintenanceMemberfisv:CorporateReconcilingItemsAndEliminationsMember2020-01-012020-12-310000798354fisv:SoftwareMaintenanceMember2020-01-012020-12-310000798354us-gaap:OperatingSegmentsMemberfisv:AcceptanceSegmentMemberfisv:LicenseAndTerminationFeesMember2020-01-012020-12-310000798354us-gaap:OperatingSegmentsMemberfisv:FintechSegmentMemberfisv:LicenseAndTerminationFeesMember2020-01-012020-12-310000798354fisv:PaymentsAndIndustryProductsSegmentMemberus-gaap:OperatingSegmentsMemberfisv:LicenseAndTerminationFeesMember2020-01-012020-12-310000798354fisv:LicenseAndTerminationFeesMemberfisv:CorporateReconcilingItemsAndEliminationsMember2020-01-012020-12-310000798354fisv:LicenseAndTerminationFeesMember2020-01-012020-12-310000798354us-gaap:OperatingSegmentsMemberfisv:OutputSolutionsPostageMemberfisv:AcceptanceSegmentMember2020-01-012020-12-310000798354us-gaap:OperatingSegmentsMemberfisv:FintechSegmentMemberfisv:OutputSolutionsPostageMember2020-01-012020-12-310000798354fisv:PaymentsAndIndustryProductsSegmentMemberus-gaap:OperatingSegmentsMemberfisv:OutputSolutionsPostageMember2020-01-012020-12-310000798354fisv:OutputSolutionsPostageMemberfisv:CorporateReconcilingItemsAndEliminationsMember2020-01-012020-12-310000798354fisv:OutputSolutionsPostageMember2020-01-012020-12-310000798354us-gaap:OperatingSegmentsMemberus-gaap:ProductAndServiceOtherMemberfisv:AcceptanceSegmentMember2020-01-012020-12-310000798354us-gaap:OperatingSegmentsMemberfisv:FintechSegmentMemberus-gaap:ProductAndServiceOtherMember2020-01-012020-12-310000798354fisv:PaymentsAndIndustryProductsSegmentMemberus-gaap:OperatingSegmentsMemberus-gaap:ProductAndServiceOtherMember2020-01-012020-12-310000798354us-gaap:ProductAndServiceOtherMemberfisv:CorporateReconcilingItemsAndEliminationsMember2020-01-012020-12-310000798354us-gaap:ProductAndServiceOtherMember2020-01-012020-12-310000798354us-gaap:OperatingSegmentsMemberfisv:AcceptanceSegmentMember2020-01-012020-12-310000798354us-gaap:OperatingSegmentsMemberfisv:FintechSegmentMember2020-01-012020-12-310000798354fisv:PaymentsAndIndustryProductsSegmentMemberus-gaap:OperatingSegmentsMember2020-01-012020-12-310000798354fisv:CorporateReconcilingItemsAndEliminationsMember2020-01-012020-12-310000798354us-gaap:OperatingSegmentsMemberfisv:AcceptanceSegmentMemberfisv:ProcessingMember2019-01-012019-12-310000798354us-gaap:OperatingSegmentsMemberfisv:FintechSegmentMemberfisv:ProcessingMember2019-01-012019-12-310000798354fisv:PaymentsAndIndustryProductsSegmentMemberus-gaap:OperatingSegmentsMemberfisv:ProcessingMember2019-01-012019-12-310000798354fisv:CorporateReconcilingItemsAndEliminationsMemberfisv:ProcessingMember2019-01-012019-12-310000798354fisv:ProcessingMember2019-01-012019-12-310000798354us-gaap:OperatingSegmentsMemberfisv:AcceptanceSegmentMemberfisv:HardwarePrintAndCardProductionMember2019-01-012019-12-310000798354us-gaap:OperatingSegmentsMemberfisv:FintechSegmentMemberfisv:HardwarePrintAndCardProductionMember2019-01-012019-12-310000798354fisv:PaymentsAndIndustryProductsSegmentMemberus-gaap:OperatingSegmentsMemberfisv:HardwarePrintAndCardProductionMember2019-01-012019-12-310000798354fisv:HardwarePrintAndCardProductionMemberfisv:CorporateReconcilingItemsAndEliminationsMember2019-01-012019-12-310000798354fisv:HardwarePrintAndCardProductionMember2019-01-012019-12-310000798354us-gaap:OperatingSegmentsMemberfisv:ProfessionalServicesMemberfisv:AcceptanceSegmentMember2019-01-012019-12-310000798354us-gaap:OperatingSegmentsMemberfisv:FintechSegmentMemberfisv:ProfessionalServicesMember2019-01-012019-12-310000798354fisv:PaymentsAndIndustryProductsSegmentMemberus-gaap:OperatingSegmentsMemberfisv:ProfessionalServicesMember2019-01-012019-12-310000798354fisv:ProfessionalServicesMemberfisv:CorporateReconcilingItemsAndEliminationsMember2019-01-012019-12-310000798354fisv:ProfessionalServicesMember2019-01-012019-12-310000798354us-gaap:OperatingSegmentsMemberfisv:SoftwareMaintenanceMemberfisv:AcceptanceSegmentMember2019-01-012019-12-310000798354us-gaap:OperatingSegmentsMemberfisv:FintechSegmentMemberfisv:SoftwareMaintenanceMember2019-01-012019-12-310000798354fisv:PaymentsAndIndustryProductsSegmentMemberus-gaap:OperatingSegmentsMemberfisv:SoftwareMaintenanceMember2019-01-012019-12-310000798354fisv:SoftwareMaintenanceMemberfisv:CorporateReconcilingItemsAndEliminationsMember2019-01-012019-12-310000798354fisv:SoftwareMaintenanceMember2019-01-012019-12-310000798354us-gaap:OperatingSegmentsMemberfisv:AcceptanceSegmentMemberfisv:LicenseAndTerminationFeesMember2019-01-012019-12-310000798354us-gaap:OperatingSegmentsMemberfisv:FintechSegmentMemberfisv:LicenseAndTerminationFeesMember2019-01-012019-12-310000798354fisv:PaymentsAndIndustryProductsSegmentMemberus-gaap:OperatingSegmentsMemberfisv:LicenseAndTerminationFeesMember2019-01-012019-12-310000798354fisv:LicenseAndTerminationFeesMemberfisv:CorporateReconcilingItemsAndEliminationsMember2019-01-012019-12-310000798354fisv:LicenseAndTerminationFeesMember2019-01-012019-12-310000798354us-gaap:OperatingSegmentsMemberfisv:OutputSolutionsPostageMemberfisv:AcceptanceSegmentMember2019-01-012019-12-310000798354us-gaap:OperatingSegmentsMemberfisv:FintechSegmentMemberfisv:OutputSolutionsPostageMember2019-01-012019-12-310000798354fisv:PaymentsAndIndustryProductsSegmentMemberus-gaap:OperatingSegmentsMemberfisv:OutputSolutionsPostageMember2019-01-012019-12-310000798354fisv:OutputSolutionsPostageMemberfisv:CorporateReconcilingItemsAndEliminationsMember2019-01-012019-12-310000798354fisv:OutputSolutionsPostageMember2019-01-012019-12-310000798354us-gaap:OperatingSegmentsMemberus-gaap:ProductAndServiceOtherMemberfisv:AcceptanceSegmentMember2019-01-012019-12-310000798354us-gaap:OperatingSegmentsMemberfisv:FintechSegmentMemberus-gaap:ProductAndServiceOtherMember2019-01-012019-12-310000798354fisv:PaymentsAndIndustryProductsSegmentMemberus-gaap:OperatingSegmentsMemberus-gaap:ProductAndServiceOtherMember2019-01-012019-12-310000798354us-gaap:ProductAndServiceOtherMemberfisv:CorporateReconcilingItemsAndEliminationsMember2019-01-012019-12-310000798354us-gaap:ProductAndServiceOtherMember2019-01-012019-12-310000798354us-gaap:OperatingSegmentsMemberfisv:AcceptanceSegmentMember2019-01-012019-12-310000798354us-gaap:OperatingSegmentsMemberfisv:FintechSegmentMember2019-01-012019-12-310000798354fisv:PaymentsAndIndustryProductsSegmentMemberus-gaap:OperatingSegmentsMember2019-01-012019-12-310000798354fisv:CorporateReconcilingItemsAndEliminationsMember2019-01-012019-12-310000798354us-gaap:OperatingSegmentsMemberfisv:FintechSegmentMemberfisv:ProcessingMember2018-01-012018-12-310000798354fisv:PaymentsAndIndustryProductsSegmentMemberus-gaap:OperatingSegmentsMemberfisv:ProcessingMember2018-01-012018-12-310000798354fisv:CorporateReconcilingItemsAndEliminationsMemberfisv:ProcessingMember2018-01-012018-12-310000798354fisv:ProcessingMember2018-01-012018-12-310000798354us-gaap:OperatingSegmentsMemberfisv:FintechSegmentMemberfisv:HardwarePrintAndCardProductionMember2018-01-012018-12-310000798354fisv:PaymentsAndIndustryProductsSegmentMemberus-gaap:OperatingSegmentsMemberfisv:HardwarePrintAndCardProductionMember2018-01-012018-12-310000798354fisv:HardwarePrintAndCardProductionMemberfisv:CorporateReconcilingItemsAndEliminationsMember2018-01-012018-12-310000798354fisv:HardwarePrintAndCardProductionMember2018-01-012018-12-310000798354us-gaap:OperatingSegmentsMemberfisv:FintechSegmentMemberfisv:ProfessionalServicesMember2018-01-012018-12-310000798354fisv:PaymentsAndIndustryProductsSegmentMemberus-gaap:OperatingSegmentsMemberfisv:ProfessionalServicesMember2018-01-012018-12-310000798354fisv:ProfessionalServicesMemberfisv:CorporateReconcilingItemsAndEliminationsMember2018-01-012018-12-310000798354fisv:ProfessionalServicesMember2018-01-012018-12-310000798354us-gaap:OperatingSegmentsMemberfisv:FintechSegmentMemberfisv:SoftwareMaintenanceMember2018-01-012018-12-310000798354fisv:PaymentsAndIndustryProductsSegmentMemberus-gaap:OperatingSegmentsMemberfisv:SoftwareMaintenanceMember2018-01-012018-12-310000798354fisv:SoftwareMaintenanceMemberfisv:CorporateReconcilingItemsAndEliminationsMember2018-01-012018-12-310000798354fisv:SoftwareMaintenanceMember2018-01-012018-12-310000798354us-gaap:OperatingSegmentsMemberfisv:FintechSegmentMemberfisv:LicenseAndTerminationFeesMember2018-01-012018-12-310000798354fisv:PaymentsAndIndustryProductsSegmentMemberus-gaap:OperatingSegmentsMemberfisv:LicenseAndTerminationFeesMember2018-01-012018-12-310000798354fisv:LicenseAndTerminationFeesMemberfisv:CorporateReconcilingItemsAndEliminationsMember2018-01-012018-12-310000798354fisv:LicenseAndTerminationFeesMember2018-01-012018-12-310000798354us-gaap:OperatingSegmentsMemberfisv:FintechSegmentMemberfisv:OutputSolutionsPostageMember2018-01-012018-12-310000798354fisv:PaymentsAndIndustryProductsSegmentMemberus-gaap:OperatingSegmentsMemberfisv:OutputSolutionsPostageMember2018-01-012018-12-310000798354fisv:OutputSolutionsPostageMemberfisv:CorporateReconcilingItemsAndEliminationsMember2018-01-012018-12-310000798354fisv:OutputSolutionsPostageMember2018-01-012018-12-310000798354us-gaap:OperatingSegmentsMemberfisv:FintechSegmentMemberus-gaap:ProductAndServiceOtherMember2018-01-012018-12-310000798354fisv:PaymentsAndIndustryProductsSegmentMemberus-gaap:OperatingSegmentsMemberus-gaap:ProductAndServiceOtherMember2018-01-012018-12-310000798354us-gaap:ProductAndServiceOtherMemberfisv:CorporateReconcilingItemsAndEliminationsMember2018-01-012018-12-310000798354us-gaap:ProductAndServiceOtherMember2018-01-012018-12-310000798354us-gaap:OperatingSegmentsMemberfisv:FintechSegmentMember2018-01-012018-12-310000798354fisv:PaymentsAndIndustryProductsSegmentMemberus-gaap:OperatingSegmentsMember2018-01-012018-12-310000798354fisv:CorporateReconcilingItemsAndEliminationsMember2018-01-012018-12-3100007983542021-01-012020-12-3100007983542022-01-012020-12-3100007983542023-01-012020-12-3100007983542024-01-012020-12-3100007983542025-01-012020-12-310000798354fisv:SalesCommissionsMember2020-12-310000798354fisv:SalesCommissionsMember2019-12-310000798354fisv:ConversionOrImplementationCostsMember2020-12-310000798354fisv:ConversionOrImplementationCostsMember2019-12-310000798354fisv:FirstDataMemberus-gaap:CommonStockMember2019-07-292019-07-290000798354fisv:EquityAwardsMemberfisv:FirstDataMember2019-07-292019-07-290000798354fisv:FirstDataMember2019-07-260000798354fisv:FirstDataMember2019-07-202020-07-290000798354us-gaap:CustomerRelatedIntangibleAssetsMemberfisv:FirstDataMember2019-07-290000798354us-gaap:OtherIntangibleAssetsMemberfisv:FirstDataMember2019-07-29fisv:entity00007983542019-07-290000798354us-gaap:CustomerRelatedIntangibleAssetsMemberfisv:FirstDataMember2019-07-292019-07-290000798354us-gaap:TechnologyBasedIntangibleAssetsMemberfisv:FirstDataMember2019-07-290000798354us-gaap:TechnologyBasedIntangibleAssetsMemberfisv:FirstDataMember2019-07-292019-07-290000798354us-gaap:TradeNamesMemberfisv:FirstDataMember2019-07-290000798354us-gaap:TradeNamesMemberfisv:FirstDataMember2019-07-292019-07-290000798354fisv:FirstDataMember2019-01-012019-12-310000798354fisv:FirstDataMemberus-gaap:SellingGeneralAndAdministrativeExpensesMember2019-01-012019-12-310000798354fisv:FirstDataMemberfisv:DebtFinancingActivitiesMember2019-01-012019-12-310000798354fisv:FirstDataMember2020-01-012020-12-310000798354fisv:ElanFinancialServicesMember2018-10-312018-10-310000798354fisv:ElanFinancialServicesMember2018-10-310000798354fisv:ElanFinancialServicesMember2020-07-012020-09-300000798354fisv:ElanFinancialServicesMember2019-12-310000798354us-gaap:CustomerRelatedIntangibleAssetsMemberfisv:ElanFinancialServicesMember2019-12-310000798354us-gaap:CustomerRelatedIntangibleAssetsMemberfisv:ElanFinancialServicesMember2019-01-012019-12-310000798354us-gaap:TradeNamesMemberfisv:ElanFinancialServicesMember2019-12-310000798354us-gaap:TradeNamesMemberfisv:ElanFinancialServicesMember2019-01-012019-12-310000798354fisv:ElanFinancialServicesMember2019-01-012019-12-310000798354us-gaap:SeriesOfIndividuallyImmaterialBusinessAcquisitionsMember2020-01-012020-12-310000798354us-gaap:SeriesOfIndividuallyImmaterialBusinessAcquisitionsMember2020-12-310000798354us-gaap:SeriesOfIndividuallyImmaterialBusinessAcquisitionsMemberfisv:SoftwareAndCustomerIntangibleAssetsMember2020-12-310000798354us-gaap:SeriesOfIndividuallyImmaterialBusinessAcquisitionsMemberfisv:ResidualBuyoutIntangibleAssetsMember2020-12-310000798354us-gaap:CustomerRelatedIntangibleAssetsMemberus-gaap:SeriesOfIndividuallyImmaterialBusinessAcquisitionsMember2020-12-310000798354us-gaap:CustomerRelatedIntangibleAssetsMemberus-gaap:SeriesOfIndividuallyImmaterialBusinessAcquisitionsMember2020-01-012020-12-310000798354fisv:ResidualBuyoutsMemberus-gaap:SeriesOfIndividuallyImmaterialBusinessAcquisitionsMember2020-12-310000798354fisv:ResidualBuyoutsMemberus-gaap:SeriesOfIndividuallyImmaterialBusinessAcquisitionsMember2020-01-012020-12-310000798354us-gaap:TechnologyBasedIntangibleAssetsMemberus-gaap:SeriesOfIndividuallyImmaterialBusinessAcquisitionsMember2020-12-310000798354us-gaap:TechnologyBasedIntangibleAssetsMemberus-gaap:SeriesOfIndividuallyImmaterialBusinessAcquisitionsMember2020-01-012020-12-310000798354fisv:BancofAmericaMerchantServicesMemberus-gaap:CorporateJointVentureMember2020-09-300000798354fisv:BancOfAmericaMerchantServicesJointVentureMemberus-gaap:CorporateJointVentureMemberfisv:BankOfAmericaMember2020-07-012020-09-300000798354fisv:BancOfAmericaMerchantServicesJointVentureMember2020-01-012020-12-310000798354fisv:BancOfAmericaMerchantServicesJointVentureMemberfisv:BankOfAmericaMember2020-07-012020-09-300000798354fisv:InvestmentServicesBusinessMember2020-02-182020-02-180000798354us-gaap:DisposalGroupDisposedOfBySaleNotDiscontinuedOperationsMember2020-02-180000798354fisv:InvestmentServicesBusinessMemberfisv:CorporateReconcilingItemsAndEliminationsMember2020-01-012020-12-310000798354us-gaap:DisposalGroupDisposedOfBySaleNotDiscontinuedOperationsMember2020-02-182020-02-180000798354fisv:InvestmentServicesBusinessMember2020-02-180000798354fisv:FinancialInstitutionServicesSegmentMemberfisv:FiservAutomotiveSolutionsLLCMember2018-03-292018-03-290000798354fisv:InvestmentServicesBusinessMemberus-gaap:DisposalGroupDisposedOfBySaleNotDiscontinuedOperationsMember2018-03-292018-03-290000798354us-gaap:DisposalGroupDisposedOfBySaleNotDiscontinuedOperationsMember2018-03-292018-03-290000798354fisv:FiservAutomotiveSolutionsAndFiservLSMemberfisv:FinancialInstitutionServicesSegmentMember2018-03-290000798354fisv:InvestmentServicesBusinessMemberus-gaap:DisposalGroupDisposedOfBySaleNotDiscontinuedOperationsMember2019-01-012019-12-310000798354us-gaap:DisposalGroupDisposedOfBySaleNotDiscontinuedOperationsMember2019-01-012019-12-310000798354fisv:InvestmentServicesBusinessMemberus-gaap:DisposalGroupDisposedOfBySaleNotDiscontinuedOperationsMember2019-08-012019-08-310000798354us-gaap:DisposalGroupDisposedOfBySaleNotDiscontinuedOperationsMember2019-08-012019-08-310000798354fisv:DefiSOLUTIONSGroupMember2019-08-310000798354us-gaap:DiscontinuedOperationsDisposedOfBySaleMember2019-07-290000798354us-gaap:DiscontinuedOperationsDisposedOfBySaleMember2019-10-31iso4217:GBP0000798354us-gaap:DiscontinuedOperationsDisposedOfBySaleMember2018-01-100000798354fisv:AcquiredSoftwareAndTechnologyMember2020-12-310000798354us-gaap:TradeNamesMember2020-12-310000798354us-gaap:ComputerSoftwareIntangibleAssetMember2020-12-310000798354fisv:CapitalizedSoftwareDevelopmentCostsMember2020-12-310000798354fisv:AcquiredSoftwareAndTechnologyMember2019-12-310000798354us-gaap:TradeNamesMember2019-12-310000798354us-gaap:ComputerSoftwareIntangibleAssetMember2019-12-310000798354fisv:CapitalizedSoftwareDevelopmentCostsMember2019-12-310000798354fisv:CapitalizedSoftwareDevelopmentCostsMember2019-01-012019-12-310000798354fisv:CapitalizedSoftwareDevelopmentCostsMember2018-01-012018-12-310000798354us-gaap:OperatingSegmentsMemberfisv:FirstDataSegmentMember2018-12-310000798354us-gaap:OperatingSegmentsMemberfisv:FinancialInstitutionServicesSegmentMember2018-12-310000798354fisv:PaymentsAndIndustryProductsSegmentMemberus-gaap:OperatingSegmentsMember2018-12-310000798354fisv:CorporateReconcilingItemsAndEliminationsMember2018-12-310000798354us-gaap:OperatingSegmentsMemberfisv:FirstDataSegmentMember2019-01-012019-12-310000798354us-gaap:OperatingSegmentsMemberfisv:FinancialInstitutionServicesSegmentMember2019-01-012019-12-310000798354us-gaap:OperatingSegmentsMemberfisv:FirstDataSegmentMember2019-12-310000798354us-gaap:OperatingSegmentsMemberfisv:FinancialInstitutionServicesSegmentMember2019-12-310000798354fisv:PaymentsAndIndustryProductsSegmentMemberus-gaap:OperatingSegmentsMember2019-12-310000798354fisv:CorporateReconcilingItemsAndEliminationsMember2019-12-310000798354us-gaap:OperatingSegmentsMemberfisv:FirstDataSegmentMember2020-01-012020-12-310000798354us-gaap:OperatingSegmentsMemberfisv:FinancialInstitutionServicesSegmentMember2020-01-012020-12-310000798354us-gaap:OperatingSegmentsMemberfisv:FirstDataSegmentMember2020-12-310000798354us-gaap:OperatingSegmentsMemberfisv:FinancialInstitutionServicesSegmentMember2020-12-310000798354fisv:PaymentsAndIndustryProductsSegmentMemberus-gaap:OperatingSegmentsMember2020-12-310000798354fisv:CorporateReconcilingItemsAndEliminationsMember2020-12-310000798354fisv:InvestmentServicesBusinessMember2019-01-012019-12-310000798354fisv:BancofAmericaMerchantServicesMember2020-12-310000798354fisv:BancofAmericaMerchantServicesMember2019-12-310000798354fisv:InvestmentServicesBusinessMember2020-01-012020-12-310000798354fisv:FiservLSLLCMember2020-01-012020-12-310000798354srt:AffiliatedEntityMember2020-12-310000798354srt:AffiliatedEntityMember2019-12-310000798354fisv:TermLoanFacilitiesMemberus-gaap:LineOfCreditMemberfisv:VariableRateTermLoanFacilitiesDueMarch2023Member2020-12-310000798354fisv:VariableRateRevolvingCreditFacilitiesDueMarch2023Memberus-gaap:LineOfCreditMemberus-gaap:RevolvingCreditFacilityMember2020-12-310000798354us-gaap:EquityMethodInvestmentNonconsolidatedInvesteeOrGroupOfInvesteesMember2020-12-310000798354us-gaap:EquityMethodInvestmentNonconsolidatedInvesteeOrGroupOfInvesteesMember2019-12-310000798354us-gaap:EquityMethodInvestmentNonconsolidatedInvesteeOrGroupOfInvesteesMember2020-01-012020-12-310000798354us-gaap:EquityMethodInvestmentNonconsolidatedInvesteeOrGroupOfInvesteesMember2019-01-012019-12-310000798354us-gaap:FairValueInputsLevel2Memberus-gaap:FairValueMeasurementsRecurringMember2020-12-310000798354us-gaap:FairValueInputsLevel2Memberus-gaap:FairValueMeasurementsRecurringMember2019-12-310000798354us-gaap:FairValueInputsLevel3Memberus-gaap:FairValueMeasurementsRecurringMember2020-12-310000798354us-gaap:FairValueInputsLevel3Memberus-gaap:FairValueMeasurementsRecurringMember2019-12-310000798354us-gaap:EstimateOfFairValueFairValueDisclosureMemberus-gaap:FairValueInputsLevel2Member2020-12-310000798354us-gaap:EstimateOfFairValueFairValueDisclosureMemberus-gaap:FairValueInputsLevel2Member2019-12-310000798354us-gaap:CarryingReportedAmountFairValueDisclosureMember2020-12-310000798354us-gaap:CarryingReportedAmountFairValueDisclosureMember2019-12-310000798354us-gaap:FairValueInputsLevel3Member2020-12-310000798354us-gaap:FairValueInputsLevel3Member2019-12-310000798354srt:CumulativeEffectPeriodOfAdoptionAdjustmentMemberus-gaap:FairValueInputsLevel3Member2020-12-310000798354fisv:LendingSolutionsBusinessMember2020-01-012020-12-310000798354fisv:LendingSolutionsBusinessMember2019-01-012019-12-310000798354fisv:LendingSolutionsBusinessMember2018-01-012018-12-310000798354srt:MinimumMember2020-12-310000798354srt:MaximumMember2020-12-310000798354us-gaap:EquipmentMember2020-12-310000798354srt:MinimumMember2020-01-012020-12-310000798354srt:MaximumMember2020-01-012020-12-310000798354us-gaap:SalesMember2020-01-012020-12-310000798354us-gaap:SalesMember2019-01-012019-12-310000798354us-gaap:CostOfSalesMember2020-01-012020-12-310000798354us-gaap:CostOfSalesMember2019-01-012019-12-310000798354srt:CumulativeEffectPeriodOfAdoptionAdjustmentMember2020-01-010000798354srt:CumulativeEffectPeriodOfAdoptionAdjustmentMember2020-12-310000798354us-gaap:LineOfCreditMember2020-12-310000798354us-gaap:LineOfCreditMember2019-12-310000798354fisv:A2.7SeniorNotesDue2020Memberus-gaap:SeniorNotesMember2020-12-310000798354fisv:A2.7SeniorNotesDue2020Memberus-gaap:SeniorNotesMember2019-12-310000798354fisv:A4.75SeniorNotesDue2021Memberus-gaap:SeniorNotesMember2020-12-310000798354fisv:A4.75SeniorNotesDue2021Memberus-gaap:SeniorNotesMember2019-12-310000798354fisv:A3.5SeniorNotesDue2022Memberus-gaap:SeniorNotesMember2020-12-310000798354fisv:A3.5SeniorNotesDue2022Memberus-gaap:SeniorNotesMember2019-12-310000798354fisv:A3.8SeniorNotesDue2023Memberus-gaap:SeniorNotesMember2018-09-300000798354fisv:A3.8SeniorNotesDue2023Memberus-gaap:SeniorNotesMember2020-12-310000798354fisv:A3.8SeniorNotesDue2023Memberus-gaap:SeniorNotesMember2019-12-310000798354fisv:A0.375SeniorNotesDueJuly2023Memberus-gaap:SeniorNotesMember2020-12-310000798354fisv:A0.375SeniorNotesDueJuly2023Memberus-gaap:SeniorNotesMember2019-12-310000798354fisv:A2.75SeniorNotesDueJuly2024Memberus-gaap:SeniorNotesMember2020-12-310000798354fisv:A2.75SeniorNotesDueJuly2024Memberus-gaap:SeniorNotesMember2019-12-310000798354us-gaap:SeniorNotesMemberfisv:A3.85SeniorNotesDue2025Member2020-12-310000798354us-gaap:SeniorNotesMemberfisv:A3.85SeniorNotesDue2025Member2019-12-310000798354fisv:A2.25SeniorNotesDueJuly2025Memberus-gaap:SeniorNotesMember2020-12-310000798354fisv:A2.25SeniorNotesDueJuly2025Memberus-gaap:SeniorNotesMember2019-12-310000798354us-gaap:SeniorNotesMemberfisv:A3.2SeniorNotesDueJuly2026Member2020-12-310000798354us-gaap:SeniorNotesMemberfisv:A3.2SeniorNotesDueJuly2026Member2019-12-310000798354fisv:A2.25SeniorNotesDue2027Memberus-gaap:SeniorNotesMember2020-12-310000798354fisv:A2.25SeniorNotesDue2027Memberus-gaap:SeniorNotesMember2019-12-310000798354us-gaap:SeniorNotesMemberfisv:A1.125SeniorNotesDueJuly2027Member2020-12-310000798354us-gaap:SeniorNotesMemberfisv:A1.125SeniorNotesDueJuly2027Member2019-12-310000798354fisv:A4.2SeniorNotesDue2028Memberus-gaap:SeniorNotesMember2018-09-300000798354fisv:A4.2SeniorNotesDue2028Memberus-gaap:SeniorNotesMember2020-12-310000798354fisv:A4.2SeniorNotesDue2028Memberus-gaap:SeniorNotesMember2019-12-310000798354fisv:A3.5SeniorNotesDueJuly2029Memberus-gaap:SeniorNotesMember2020-12-310000798354fisv:A3.5SeniorNotesDueJuly2029Memberus-gaap:SeniorNotesMember2019-12-310000798354fisv:A2.65SeniorNotesDue2030Memberus-gaap:SeniorNotesMember2020-12-310000798354fisv:A2.65SeniorNotesDue2030Memberus-gaap:SeniorNotesMember2019-12-310000798354us-gaap:SeniorNotesMemberfisv:A1.625SeniorNotesDueJuly2030Member2020-12-310000798354us-gaap:SeniorNotesMemberfisv:A1.625SeniorNotesDueJuly2030Member2019-12-310000798354fisv:A3.0SeniorNotesDueJuly2031Memberus-gaap:SeniorNotesMember2020-12-310000798354fisv:A3.0SeniorNotesDueJuly2031Memberus-gaap:SeniorNotesMember2019-12-310000798354fisv:A4.4SeniorNotesDueJuly2049Memberus-gaap:SeniorNotesMember2020-12-310000798354fisv:A4.4SeniorNotesDueJuly2049Memberus-gaap:SeniorNotesMember2019-12-310000798354us-gaap:SecuredDebtMember2020-12-310000798354us-gaap:SecuredDebtMember2019-12-310000798354fisv:TermLoanFacilityMemberus-gaap:LineOfCreditMember2020-12-310000798354fisv:TermLoanFacilityMemberus-gaap:LineOfCreditMember2019-12-310000798354us-gaap:RevolvingCreditFacilityMemberus-gaap:LineOfCreditMember2020-12-310000798354us-gaap:RevolvingCreditFacilityMemberus-gaap:LineOfCreditMember2019-12-310000798354us-gaap:LineOfCreditMemberus-gaap:SeniorNotesMember2020-12-310000798354us-gaap:SeniorNotesMember2020-05-130000798354fisv:A2.25SeniorNotesDue2027Memberus-gaap:SeniorNotesMember2020-05-130000798354fisv:A2.65SeniorNotesDue2030Memberus-gaap:SeniorNotesMember2020-05-130000798354fisv:A2.7SeniorNotesDue2020Memberus-gaap:SeniorNotesMember2020-01-012020-12-310000798354us-gaap:RevolvingCreditFacilityMember2020-01-012020-12-310000798354fisv:A2.75SeniorNotesDueJuly2024Memberus-gaap:SeniorNotesMember2019-06-240000798354fisv:A4.4SeniorNotesDueJuly2049Memberus-gaap:SeniorNotesMember2019-06-240000798354us-gaap:ForeignExchangeContractMember2019-06-240000798354fisv:A0.375SeniorNotesDueJuly2023Memberus-gaap:SeniorNotesMember2019-07-010000798354us-gaap:SeniorNotesMemberfisv:A1.625SeniorNotesDueJuly2030Member2019-07-01iso4217:EUR0000798354fisv:ForeignExchangeContractEuroAndBritishPoundDenominatedSeniorNotesMember2019-06-240000798354fisv:A2.25SeniorNotesDueJuly2025Memberus-gaap:SeniorNotesMember2019-07-010000798354fisv:A3.0SeniorNotesDueJuly2031Memberus-gaap:SeniorNotesMember2019-07-010000798354fisv:ForeignExchangeContractEuroAndBritishPoundDenominatedCashMember2019-07-010000798354us-gaap:RevolvingCreditFacilityMemberus-gaap:LineOfCreditMember2019-06-012019-06-300000798354fisv:TermLoanFacilityMemberfisv:SeniorUnsecuredTermLoanFacilityMemberus-gaap:LineOfCreditMember2019-02-150000798354fisv:TermLoanFacilityMemberus-gaap:LineOfCreditMemberfisv:SeniorUnsecuredTermLoanFacilityLoansWithThreeYearMaturityMember2019-02-150000798354fisv:TermLoanFacilityMemberus-gaap:LineOfCreditMemberfisv:SeniorUnsecuredTermLoanFacilityLoansWithThreeYearMaturityMember2019-02-152019-02-150000798354fisv:SeniorUnsecuredTermLoanFacilityLoansWithFiveYearMaturityMemberfisv:TermLoanFacilityMemberus-gaap:LineOfCreditMember2019-02-150000798354fisv:SeniorUnsecuredTermLoanFacilityLoansWithFiveYearMaturityMemberfisv:TermLoanFacilityMemberus-gaap:LineOfCreditMember2019-02-152019-02-150000798354fisv:DebtInstrumentAmortizationPeriodOneMemberfisv:TermLoanFacilityMemberfisv:SeniorUnsecuredTermLoanFacilityMemberus-gaap:LineOfCreditMember2019-02-152019-02-150000798354fisv:DebtInstrumentAmortizationPeriodTwoMemberfisv:TermLoanFacilityMemberfisv:SeniorUnsecuredTermLoanFacilityMemberus-gaap:LineOfCreditMember2019-02-152019-02-150000798354fisv:TermLoanFacilityMemberfisv:DebtInstrumentAmortizationPeriodThreeMemberfisv:SeniorUnsecuredTermLoanFacilityMemberus-gaap:LineOfCreditMember2019-02-152019-02-150000798354us-gaap:RevolvingCreditFacilityMemberus-gaap:LineOfCreditMember2019-02-150000798354us-gaap:ForeignLineOfCreditMember2020-12-310000798354us-gaap:ForeignLineOfCreditMember2019-12-310000798354us-gaap:SecuredDebtMemberfisv:A2.9SeniorNotesDue2020Member2020-12-310000798354us-gaap:SecuredDebtMemberfisv:A2.9SeniorNotesDue2020Member2019-12-310000798354fisv:LoansPayableAndSeniorNotesMember2020-12-310000798354fisv:LoansPayableAndSeniorNotesMember2019-12-310000798354us-gaap:RevolvingCreditFacilityMember2020-12-310000798354us-gaap:RevolvingCreditFacilityMember2019-12-310000798354fisv:SeniorUnsecuredBridgeTermLoanFacilityMemberus-gaap:LineOfCreditMemberus-gaap:BridgeLoanMember2019-01-160000798354fisv:SeniorUnsecuredBridgeTermLoanFacilityMemberus-gaap:LineOfCreditMemberus-gaap:BridgeLoanMember2020-01-012020-12-310000798354us-gaap:ForeignExchangeContractMember2019-01-012019-12-310000798354fisv:ForeignExchangeContractEuroAndBritishPoundDenominatedSeniorNotesMember2019-01-012019-12-310000798354fisv:ForeignExchangeContractEuroAndBritishPoundDenominatedCashMember2019-01-012019-12-310000798354us-gaap:SeniorNotesMember2018-09-300000798354fisv:A4.2SeniorNotesDue2028Memberus-gaap:LineOfCreditMemberus-gaap:SeniorNotesMember2018-09-300000798354us-gaap:SeniorNotesMember2020-01-012020-12-310000798354us-gaap:RevolvingCreditFacilityMember2018-09-012018-09-300000798354fisv:SeniorNotes4.625PercentDueOctober2020Memberus-gaap:SeniorNotesMember2018-09-3000007983542018-09-3000007983542018-09-260000798354fisv:SeniorNotes4.625PercentDueOctober2020Memberus-gaap:SeniorNotesMember2018-09-262018-09-2600007983542018-10-310000798354fisv:SeniorNotes4.625PercentDueOctober2020Memberus-gaap:SeniorNotesMember2018-01-012018-12-310000798354us-gaap:RevolvingCreditFacilityMember2018-10-012018-10-310000798354fisv:DebtInstrumentOptionOneMemberus-gaap:RevolvingCreditFacilityMember2019-02-062019-02-060000798354fisv:DebtInstrumentOptionTwoMemberus-gaap:RevolvingCreditFacilityMember2019-02-062019-02-06fisv:noncontrollingInterest0000798354fisv:FirstDataMember2020-12-310000798354fisv:FirstDataJointVentureMember2020-12-310000798354us-gaap:AccumulatedGainLossNetCashFlowHedgeParentMember2019-12-310000798354us-gaap:AccumulatedTranslationAdjustmentMember2019-12-310000798354us-gaap:AccumulatedDefinedBenefitPlansAdjustmentMember2019-12-310000798354us-gaap:AccumulatedGainLossNetCashFlowHedgeParentMember2020-01-012020-12-310000798354us-gaap:AccumulatedTranslationAdjustmentMember2020-01-012020-12-310000798354us-gaap:AccumulatedDefinedBenefitPlansAdjustmentMember2020-01-012020-12-310000798354us-gaap:AccumulatedGainLossNetCashFlowHedgeParentMember2020-12-310000798354us-gaap:AccumulatedTranslationAdjustmentMember2020-12-310000798354us-gaap:AccumulatedDefinedBenefitPlansAdjustmentMember2020-12-310000798354us-gaap:AccumulatedGainLossNetCashFlowHedgeParentMember2018-12-310000798354us-gaap:AccumulatedTranslationAdjustmentMember2018-12-310000798354us-gaap:AccumulatedDefinedBenefitPlansAdjustmentMember2018-12-310000798354us-gaap:AccumulatedGainLossNetCashFlowHedgeParentMember2019-01-012019-12-310000798354us-gaap:AccumulatedTranslationAdjustmentMember2019-01-012019-12-310000798354us-gaap:AccumulatedDefinedBenefitPlansAdjustmentMember2019-01-012019-12-310000798354us-gaap:ForeignExchangeContractMembercurrency:INR2020-12-310000798354us-gaap:ForeignExchangeContractMembercurrency:INR2019-12-310000798354us-gaap:TreasuryLockMember2020-03-3100007983542019-06-242019-06-240000798354country:GB2019-12-310000798354country:GB2018-12-310000798354fisv:UnitedStatesAndOtherForeignPensionPlansDefinedBenefitMember2019-12-310000798354fisv:UnitedStatesAndOtherForeignPensionPlansDefinedBenefitMember2018-12-310000798354country:GB2020-01-012020-12-310000798354country:GB2019-01-012019-12-310000798354fisv:UnitedStatesAndOtherForeignPensionPlansDefinedBenefitMember2020-01-012020-12-310000798354fisv:UnitedStatesAndOtherForeignPensionPlansDefinedBenefitMember2019-01-012019-12-310000798354country:GB2020-12-310000798354fisv:UnitedStatesAndOtherForeignPensionPlansDefinedBenefitMember2020-12-31fisv:investment_pool0000798354fisv:DefinedBenefitPlanOnRiskAssetsMembercountry:GB2020-12-310000798354country:GBfisv:DefinedBenefitPlanOffRiskAssetsMember2020-12-310000798354fisv:DefinedBenefitPlanOnRiskAssetsMemberfisv:UnitedStatesAndOtherForeignPensionPlansDefinedBenefitMember2020-12-310000798354fisv:UnitedStatesAndOtherForeignPensionPlansDefinedBenefitMemberfisv:DefinedBenefitPlanOffRiskAssetsMember2020-12-310000798354us-gaap:DefinedBenefitPlanCashAndCashEquivalentsMemberus-gaap:FairValueInputsLevel1Memberus-gaap:FairValueMeasurementsRecurringMember2020-12-310000798354us-gaap:DefinedBenefitPlanCashAndCashEquivalentsMemberus-gaap:FairValueInputsLevel2Memberus-gaap:FairValueMeasurementsRecurringMember2020-12-310000798354us-gaap:DefinedBenefitPlanCashAndCashEquivalentsMemberus-gaap:FairValueInputsLevel3Memberus-gaap:FairValueMeasurementsRecurringMember2020-12-310000798354us-gaap:DefinedBenefitPlanEquitySecuritiesMemberus-gaap:FairValueInputsLevel1Memberus-gaap:FairValueMeasurementsRecurringMember2020-12-310000798354us-gaap:DefinedBenefitPlanEquitySecuritiesMemberus-gaap:FairValueInputsLevel2Memberus-gaap:FairValueMeasurementsRecurringMember2020-12-310000798354us-gaap:DefinedBenefitPlanEquitySecuritiesMemberus-gaap:FairValueInputsLevel3Memberus-gaap:FairValueMeasurementsRecurringMember2020-12-310000798354us-gaap:FixedIncomeSecuritiesMemberus-gaap:FairValueInputsLevel1Memberus-gaap:FairValueMeasurementsRecurringMember2020-12-310000798354us-gaap:FixedIncomeSecuritiesMemberus-gaap:FairValueInputsLevel2Memberus-gaap:FairValueMeasurementsRecurringMember2020-12-310000798354us-gaap:FixedIncomeSecuritiesMemberus-gaap:FairValueInputsLevel3Memberus-gaap:FairValueMeasurementsRecurringMember2020-12-310000798354fisv:DefinedBenefitPlanOtherInvestmentsMemberus-gaap:FairValueInputsLevel1Memberus-gaap:FairValueMeasurementsRecurringMember2020-12-310000798354fisv:DefinedBenefitPlanOtherInvestmentsMemberus-gaap:FairValueInputsLevel2Memberus-gaap:FairValueMeasurementsRecurringMember2020-12-310000798354fisv:DefinedBenefitPlanOtherInvestmentsMemberus-gaap:FairValueInputsLevel3Memberus-gaap:FairValueMeasurementsRecurringMember2020-12-310000798354us-gaap:FairValueInputsLevel1Memberus-gaap:FairValueMeasurementsRecurringMember2020-12-310000798354us-gaap:DefinedBenefitPlanCashAndCashEquivalentsMemberus-gaap:FairValueInputsLevel1Memberus-gaap:FairValueMeasurementsRecurringMember2019-12-310000798354us-gaap:DefinedBenefitPlanCashAndCashEquivalentsMemberus-gaap:FairValueInputsLevel2Memberus-gaap:FairValueMeasurementsRecurringMember2019-12-310000798354us-gaap:DefinedBenefitPlanCashAndCashEquivalentsMemberus-gaap:FairValueInputsLevel3Memberus-gaap:FairValueMeasurementsRecurringMember2019-12-310000798354us-gaap:DefinedBenefitPlanEquitySecuritiesMemberus-gaap:FairValueInputsLevel1Memberus-gaap:FairValueMeasurementsRecurringMember2019-12-310000798354us-gaap:DefinedBenefitPlanEquitySecuritiesMemberus-gaap:FairValueInputsLevel2Memberus-gaap:FairValueMeasurementsRecurringMember2019-12-310000798354us-gaap:DefinedBenefitPlanEquitySecuritiesMemberus-gaap:FairValueInputsLevel3Memberus-gaap:FairValueMeasurementsRecurringMember2019-12-310000798354us-gaap:FixedIncomeSecuritiesMemberus-gaap:FairValueInputsLevel1Memberus-gaap:FairValueMeasurementsRecurringMember2019-12-310000798354us-gaap:FixedIncomeSecuritiesMemberus-gaap:FairValueInputsLevel2Memberus-gaap:FairValueMeasurementsRecurringMember2019-12-310000798354us-gaap:FixedIncomeSecuritiesMemberus-gaap:FairValueInputsLevel3Memberus-gaap:FairValueMeasurementsRecurringMember2019-12-310000798354fisv:DefinedBenefitPlanOtherInvestmentsMemberus-gaap:FairValueInputsLevel1Memberus-gaap:FairValueMeasurementsRecurringMember2019-12-310000798354fisv:DefinedBenefitPlanOtherInvestmentsMemberus-gaap:FairValueInputsLevel2Memberus-gaap:FairValueMeasurementsRecurringMember2019-12-310000798354fisv:DefinedBenefitPlanOtherInvestmentsMemberus-gaap:FairValueInputsLevel3Memberus-gaap:FairValueMeasurementsRecurringMember2019-12-310000798354us-gaap:FairValueInputsLevel1Memberus-gaap:FairValueMeasurementsRecurringMember2019-12-310000798354us-gaap:HedgeFundsMemberus-gaap:FairValueMeasuredAtNetAssetValuePerShareMember2020-12-310000798354us-gaap:HedgeFundsMemberus-gaap:FairValueMeasuredAtNetAssetValuePerShareMember2019-12-310000798354srt:MinimumMemberus-gaap:EmployeeStockOptionMember2020-01-012020-12-310000798354srt:MaximumMemberus-gaap:EmployeeStockOptionMember2020-01-012020-12-310000798354us-gaap:EmployeeStockOptionMember2020-01-012020-12-310000798354fisv:RestrictedStockAwardsMembersrt:MinimumMember2020-01-012020-12-310000798354us-gaap:RestrictedStockUnitsRSUMembersrt:MinimumMember2020-01-012020-12-310000798354fisv:RestrictedStockAwardsMembersrt:MaximumMember2020-01-012020-12-310000798354us-gaap:RestrictedStockUnitsRSUMembersrt:MaximumMember2020-01-012020-12-310000798354us-gaap:EmployeeStockMember2019-01-012019-12-310000798354us-gaap:EmployeeStockMember2020-01-012020-12-310000798354us-gaap:SubsequentEventMemberus-gaap:EmployeeStockMember2021-01-012021-12-310000798354us-gaap:EmployeeStockOptionMember2019-01-012019-12-310000798354us-gaap:EmployeeStockOptionMember2018-01-012018-12-310000798354fisv:EquityAwardsMemberfisv:FirstDataMember2019-07-290000798354us-gaap:RestrictedStockUnitsRSUMember2019-12-310000798354us-gaap:PerformanceSharesMember2019-12-310000798354us-gaap:RestrictedStockUnitsRSUMember2020-01-012020-12-310000798354us-gaap:PerformanceSharesMember2020-01-012020-12-310000798354us-gaap:RestrictedStockUnitsRSUMember2020-12-310000798354us-gaap:PerformanceSharesMember2020-12-310000798354fisv:RestrictedStockAwardsMember2019-12-310000798354fisv:RestrictedStockAwardsMember2020-01-012020-12-310000798354fisv:RestrictedStockAwardsMember2020-12-310000798354us-gaap:EmployeeStockMember2018-01-012018-12-310000798354us-gaap:EmployeeStockMember2020-12-310000798354us-gaap:EmployeeSeveranceMember2020-01-012020-12-310000798354us-gaap:EmployeeSeveranceMember2019-01-012019-12-310000798354us-gaap:EmployeeSeveranceMember2019-12-310000798354us-gaap:EmployeeSeveranceMember2018-12-310000798354us-gaap:EmployeeSeveranceMember2020-12-310000798354fisv:FirstDataMember2019-07-302020-07-290000798354us-gaap:DomesticCountryMember2020-12-310000798354us-gaap:DomesticCountryMember2019-12-310000798354us-gaap:StateAndLocalJurisdictionMember2020-12-310000798354us-gaap:StateAndLocalJurisdictionMember2019-12-310000798354us-gaap:ForeignCountryMember2020-12-310000798354us-gaap:ForeignCountryMember2019-12-310000798354us-gaap:GeneralBusinessMember2020-12-310000798354us-gaap:GeneralBusinessMember2019-12-310000798354fisv:TaxYear2020Through2037Memberus-gaap:DomesticCountryMember2020-12-310000798354fisv:TaxYear2021Through2039Memberus-gaap:StateAndLocalJurisdictionMember2020-12-310000798354fisv:TaxYear2020Through2039Memberus-gaap:ForeignCountryMember2020-12-310000798354fisv:TaxYear2027Through2039Memberus-gaap:GeneralBusinessMember2020-12-310000798354fisv:FirstDataMemberfisv:FirstDataSubsidiaryMerchantMattersMember2020-07-012020-09-300000798354fisv:FirstDataMemberfisv:FirstDataSubsidiaryMerchantMattersMember2020-12-310000798354fisv:FirstDataMemberfisv:FirstDataSubsidiaryMerchantMattersMember2019-12-310000798354srt:MinimumMemberfisv:FirstDataMemberfisv:FirstDataSubsidiaryMerchantMattersMember2020-12-310000798354fisv:FirstDataMembersrt:MaximumMemberfisv:FirstDataSubsidiaryMerchantMattersMember2020-12-310000798354fisv:MerchantAlliancesFeesMemberus-gaap:EquityMethodInvesteeMember2020-01-012020-12-310000798354fisv:MerchantAlliancesFeesMemberus-gaap:EquityMethodInvesteeMember2019-01-012019-12-310000798354us-gaap:EquityMethodInvesteeMember2020-12-310000798354us-gaap:EquityMethodInvesteeMember2019-12-310000798354fisv:BancofAmericaMerchantServicesMemberus-gaap:CorporateJointVentureMember2020-12-310000798354fisv:LendingSolutionsBusinessAndInvestmentServicesBusinessMemberfisv:RelatedPartyFeesMembersrt:AffiliatedEntityMember2020-01-012020-12-310000798354fisv:LendingSolutionsBusinessAndInvestmentServicesBusinessMemberfisv:RelatedPartyFeesMembersrt:AffiliatedEntityMember2019-01-012019-12-310000798354fisv:LendingSolutionsBusinessAndInvestmentServicesBusinessMemberfisv:RelatedPartyFeesMembersrt:AffiliatedEntityMember2018-01-012018-12-310000798354fisv:FiservMember2020-12-142020-12-140000798354fisv:NewOmahaHoldingsMember2020-12-142020-12-140000798354fisv:NewOmahaHoldingsMember2019-12-042019-12-040000798354fisv:FiservMemberfisv:NewOmahaHoldingsMember2020-12-310000798354fisv:FiservMemberfisv:NewOmahaHoldingsMember2020-12-140000798354us-gaap:OperatingSegmentsMemberfisv:ProcessingAndServicesMemberfisv:FirstDataSegmentMember2020-01-012020-12-310000798354us-gaap:OperatingSegmentsMemberfisv:ProcessingAndServicesMemberfisv:FinancialInstitutionServicesSegmentMember2020-01-012020-12-310000798354fisv:PaymentsAndIndustryProductsSegmentMemberus-gaap:OperatingSegmentsMemberfisv:ProcessingAndServicesMember2020-01-012020-12-310000798354fisv:ProcessingAndServicesMemberfisv:CorporateReconcilingItemsAndEliminationsMember2020-01-012020-12-310000798354us-gaap:OperatingSegmentsMemberus-gaap:ProductMemberfisv:FirstDataSegmentMember2020-01-012020-12-310000798354us-gaap:OperatingSegmentsMemberfisv:FinancialInstitutionServicesSegmentMemberus-gaap:ProductMember2020-01-012020-12-310000798354fisv:PaymentsAndIndustryProductsSegmentMemberus-gaap:OperatingSegmentsMemberus-gaap:ProductMember2020-01-012020-12-310000798354us-gaap:ProductMemberfisv:CorporateReconcilingItemsAndEliminationsMember2020-01-012020-12-310000798354us-gaap:OperatingSegmentsMemberfisv:ProcessingAndServicesMemberfisv:FirstDataSegmentMember2019-01-012019-12-310000798354us-gaap:OperatingSegmentsMemberfisv:ProcessingAndServicesMemberfisv:FinancialInstitutionServicesSegmentMember2019-01-012019-12-310000798354fisv:PaymentsAndIndustryProductsSegmentMemberus-gaap:OperatingSegmentsMemberfisv:ProcessingAndServicesMember2019-01-012019-12-310000798354fisv:ProcessingAndServicesMemberfisv:CorporateReconcilingItemsAndEliminationsMember2019-01-012019-12-310000798354us-gaap:OperatingSegmentsMemberus-gaap:ProductMemberfisv:FirstDataSegmentMember2019-01-012019-12-310000798354us-gaap:OperatingSegmentsMemberfisv:FinancialInstitutionServicesSegmentMemberus-gaap:ProductMember2019-01-012019-12-310000798354fisv:PaymentsAndIndustryProductsSegmentMemberus-gaap:OperatingSegmentsMemberus-gaap:ProductMember2019-01-012019-12-310000798354us-gaap:ProductMemberfisv:CorporateReconcilingItemsAndEliminationsMember2019-01-012019-12-310000798354us-gaap:OperatingSegmentsMemberfisv:ProcessingAndServicesMemberfisv:FirstDataSegmentMember2018-01-012018-12-310000798354us-gaap:OperatingSegmentsMemberfisv:ProcessingAndServicesMemberfisv:FinancialInstitutionServicesSegmentMember2018-01-012018-12-310000798354fisv:PaymentsAndIndustryProductsSegmentMemberus-gaap:OperatingSegmentsMemberfisv:ProcessingAndServicesMember2018-01-012018-12-310000798354fisv:ProcessingAndServicesMemberfisv:CorporateReconcilingItemsAndEliminationsMember2018-01-012018-12-310000798354us-gaap:OperatingSegmentsMemberus-gaap:ProductMemberfisv:FirstDataSegmentMember2018-01-012018-12-310000798354us-gaap:OperatingSegmentsMemberfisv:FinancialInstitutionServicesSegmentMemberus-gaap:ProductMember2018-01-012018-12-310000798354fisv:PaymentsAndIndustryProductsSegmentMemberus-gaap:OperatingSegmentsMemberus-gaap:ProductMember2018-01-012018-12-310000798354us-gaap:ProductMemberfisv:CorporateReconcilingItemsAndEliminationsMember2018-01-012018-12-310000798354us-gaap:OperatingSegmentsMemberfisv:FirstDataSegmentMember2018-01-012018-12-310000798354us-gaap:OperatingSegmentsMemberfisv:FinancialInstitutionServicesSegmentMember2018-01-012018-12-310000798354fisv:FinancialInstitutionServicesSegmentMemberfisv:FiservAutomotiveSolutionsLLCMember2020-01-012020-12-310000798354fisv:LendingSolutionsBusinessMemberfisv:CorporateReconcilingItemsAndEliminationsMember2019-01-012019-12-3100007983542020-01-012020-03-3100007983542020-04-012020-06-3000007983542020-07-012020-09-3000007983542020-10-012020-12-310000798354fisv:ProcessingAndServicesMember2020-01-012020-03-310000798354fisv:ProcessingAndServicesMember2020-04-012020-06-300000798354fisv:ProcessingAndServicesMember2020-07-012020-09-300000798354fisv:ProcessingAndServicesMember2020-10-012020-12-310000798354us-gaap:ProductMember2020-01-012020-03-310000798354us-gaap:ProductMember2020-04-012020-06-300000798354us-gaap:ProductMember2020-07-012020-09-300000798354us-gaap:ProductMember2020-10-012020-12-3100007983542019-01-012019-03-3100007983542019-04-012019-06-3000007983542019-07-012019-09-3000007983542019-10-012019-12-310000798354fisv:ProcessingAndServicesMember2019-01-012019-03-310000798354fisv:ProcessingAndServicesMember2019-04-012019-06-300000798354fisv:ProcessingAndServicesMember2019-07-012019-09-300000798354fisv:ProcessingAndServicesMember2019-10-012019-12-310000798354us-gaap:ProductMember2019-01-012019-03-310000798354us-gaap:ProductMember2019-04-012019-06-300000798354us-gaap:ProductMember2019-07-012019-09-300000798354us-gaap:ProductMember2019-10-012019-12-310000798354us-gaap:ValuationAllowanceOfDeferredTaxAssetsMember2019-12-310000798354us-gaap:ValuationAllowanceOfDeferredTaxAssetsMember2020-01-012020-12-310000798354us-gaap:ValuationAllowanceOfDeferredTaxAssetsMember2020-12-310000798354us-gaap:ValuationAllowanceOfDeferredTaxAssetsMember2018-12-310000798354us-gaap:ValuationAllowanceOfDeferredTaxAssetsMember2019-01-012019-12-310000798354us-gaap:ValuationAllowanceOfDeferredTaxAssetsMember2017-12-310000798354us-gaap:ValuationAllowanceOfDeferredTaxAssetsMember2018-01-012018-12-31
UNITED STATES
SECURITIES AND EXCHANGE COMMISSION
WASHINGTON, DC 20549
FORM 10-K
| | | | | | | | |
| ☑ | ANNUAL REPORT PURSUANT TO SECTION 13 OR 15(d) OF THE SECURITIES EXCHANGE ACT OF 1934 |
| For the fiscal year ended: | December 31, 2020 |
OR
| | | | | |
| ☐ | TRANSITION REPORT PURSUANT TO SECTION 13 OR 15(d) OF THE SECURITIES EXCHANGE ACT OF 1934 For the transition period from to |
Commission file number: 1-38962
Fiserv, Inc.
(Exact Name of Registrant as Specified in Its Charter)
| | | | | | | | |
| Wisconsin | | 39-1506125 |
(State or Other Jurisdiction of
Incorporation or Organization) | | (I. R. S. Employer
Identification No.) |
| | | | | | | | | | | |
| 255 Fiserv Drive | Brookfield, | WI | 53045 |
| (Address of Principal Executive Offices and zip code) |
(262) 879-5000
(Registrant’s Telephone Number, Including Area Code)
Securities registered pursuant to Section 12(b) of the Act:
| | | | | | | | | | | | | | |
| Title of each class | | Trading Symbol(s) | | Name of each exchange on which registered |
| Common Stock, par value $0.01 per share | | FISV | | The NASDAQ Stock Market LLC |
| 0.375% Senior Notes due 2023 | | FISV23 | | The NASDAQ Stock Market LLC |
| 1.125% Senior Notes due 2027 | | FISV27 | | The NASDAQ Stock Market LLC |
| 1.625% Senior Notes due 2030 | | FISV30 | | The NASDAQ Stock Market LLC |
| 2.250% Senior Notes due 2025 | | FISV25 | | The NASDAQ Stock Market LLC |
| 3.000% Senior Notes due 2031 | | FISV31 | | The NASDAQ Stock Market LLC |
Securities registered pursuant to Section 12(g) of the Act: None
Indicate by check mark if the registrant is a well-known seasoned issuer, as defined in Rule 405 of the Securities Act. Yes ☑ No ☐
Indicate by check mark if the registrant is not required to file reports pursuant to Section 13 or 15(d) of the Act. Yes ☐ No ☑
Indicate by check mark whether the registrant: (1) has filed all reports required to be filed by Section 13 or 15(d) of the Securities Exchange Act of 1934 during the preceding 12 months (or for such shorter period that the registrant was required to file such reports), and (2) has been subject to such filing requirements for the past 90 days. Yes ☑ No ☐
Indicate by check mark whether the registrant has submitted electronically every Interactive Data File required to be submitted pursuant to Rule 405 of Regulation S-T during the preceding 12 months (or for such shorter period that the registrant was required to submit such files). Yes ☑ No ☐
Indicate by check mark whether the registrant is a large accelerated filer, an accelerated filer, a non-accelerated filer, a smaller reporting company, or an emerging growth company. See the definitions of “large accelerated filer,” “accelerated filer,” “smaller reporting company,” and “emerging growth company” in Rule 12b-2 of the Exchange Act.
| | | | | | | | | | | | | | |
| Large accelerated filer | ☑ | | Accelerated filer | ☐ |
| Non-accelerated filer | ☐ | | Smaller reporting company | ☐ |
| | | Emerging growth company | ☐ |
If an emerging growth company, indicate by check mark if the registrant has elected not to use the extended transition period for complying with any new or revised financial accounting standards provided pursuant to Section 13(a) of the Exchange Act. ☐
Indicate by check mark whether the registrant has filed a report on and attestation to its management’s assessment of the effectiveness of its internal control over financial reporting under Section 404(b) of the Sarbanes-Oxley Act (15 U.S.C. 7262(b)) by the registered public accounting firm that prepared or issued its audit report. ☑
Indicate by check mark whether the registrant is a shell company (as defined in Rule 12b-2 of the Exchange Act). Yes ☐ No ☑
The aggregate market value of the common stock of the registrant held by non-affiliates as of June 30, 2020 (the last trading day of the second fiscal quarter) was $65,119,434,315 based on the closing price of the registrant’s common stock on the NASDAQ Global Select Market on that date. The number of shares of the registrant’s common stock, $0.01 par value per share, outstanding at February 19, 2021 was 669,459,877.
DOCUMENTS INCORPORATED BY REFERENCE
Part III of this report incorporates information by reference to the registrant’s proxy statement for its 2021 annual meeting of shareholders, which proxy statement will be filed with the Securities and Exchange Commission no later than 120 days after the close of the fiscal year ended December 31, 2020.
TABLE OF CONTENTS
| | | | | | | | |
| | Page |
| PART I | |
| | |
| Item 1. | | |
| | |
| Item 1A. | | |
| | |
| Item 1B. | | |
| | |
| Item 2. | | |
| | |
| Item 3. | | |
| | |
| Item 4. | | |
| | |
| | |
| |
| PART II | |
| | |
| Item 5. | | |
| | |
| Item 6. | | |
| | |
| Item 7. | | |
| | |
| Item 7A. | | |
| | |
| Item 8. | | |
| | |
| Item 9. | | |
| | |
| Item 9A. | | |
| | |
| Item 9B. | | |
| |
| PART III | |
| | |
| Item 10. | | |
| | |
| Item 11. | | |
| | |
| Item 12. | | |
| | |
| Item 13. | | |
| | |
| Item 14. | | |
| |
| PART IV | |
| | |
| Item 15. | | |
| | |
| Item 16. | | |
| | |
| | |
FORWARD-LOOKING STATEMENTS
This Annual Report on Form 10-K contains “forward-looking statements” intended to qualify for the safe harbor from liability established by the Private Securities Litigation Reform Act of 1995. Forward-looking statements include those that express a plan, belief, expectation, estimation, anticipation, intent, contingency, future development or similar expression, and can generally be identified as forward-looking because they include words such as “believes,” “anticipates,” “expects,” “could,” “should” or words of similar meaning. Statements that describe our future plans, objectives or goals are also forward-looking statements. The forward-looking statements in this report involve significant risks and uncertainties, and a number of factors, both foreseen and unforeseen, could cause actual results to differ materially from our current expectations. The factors that may affect our results include, among others, the following, many of which are, and will be, amplified by the COVID-19 pandemic: the duration and intensity of the COVID-19 pandemic including how quickly the global economy recovers from the impact of the pandemic; governmental and private sector responses to the COVID-19 pandemic and the impact of such responses on us; the impact of the COVID-19 pandemic on our employees, clients, vendors, operations and sales; the possibility that we may be unable to achieve expected synergies and operating efficiencies from the acquisition of First Data Corporation (“First Data”) within the expected time frames; the integration of First Data may be more difficult, time-consuming or costly than expected; profitability following the transaction may be lower than expected, including due to unexpected costs, charges or expenses resulting from the transaction; operating costs, customer loss and business disruption (including, without limitation, difficulties in maintaining relationships with employees, customers, clients or suppliers) may be greater than expected following the transaction; unforeseen risks relating to our liabilities or those of First Data may exist; our ability to meet expectations regarding the accounting and tax treatments of the transaction; our ability to compete effectively against new and existing competitors and to continue to introduce competitive new products and services on a timely, cost-effective basis; changes in customer demand for our products and services; the ability of our technology to keep pace with a rapidly evolving marketplace; the successful management of our merchant alliance program which involves several alliances not under our sole control; the impact of a security breach or operational failure on our business including disruptions caused by other participants in the global financial system; the failure of our vendors and merchants to satisfy their obligations; the successful management of credit and fraud risks in our business and merchant alliances; changes in local, regional, national and international economic or political conditions and the impact they may have on us and our customers; the effect of proposed and enacted legislative and regulatory actions affecting us or the financial services industry as a whole; our ability to comply with government regulations and applicable card association and network rules; the protection and validity of intellectual property rights; the outcome of pending and future litigation and governmental proceedings; our ability to successfully identify, complete and integrate acquisitions, and to realize the anticipated benefits associated with the same; the impact of our strategic initiatives; our ability to attract and retain key personnel; volatility and disruptions in financial markets that may impact our ability to access preferred sources of financing and the terms on which we are able to obtain financing or increase our cost of borrowing; adverse impacts from currency exchange rates or currency controls; changes in corporate tax and interest rates; and other factors identified in this Annual Report on Form 10-K for the year ended December 31, 2020 and in other documents that we file with the Securities and Exchange Commission. You should consider these factors carefully in evaluating forward-looking statements and are cautioned not to place undue reliance on such statements, which speak only as of the date of this report. We undertake no obligation to update forward-looking statements to reflect events or circumstances occurring after the date of this report. We are not including the information provided on the websites referenced herein as part of, or incorporating such information by reference into, this Annual Report on Form 10-K.
PART I
In this report, all references to “we,” “us,” “our” and “Fiserv” refer to Fiserv, Inc. (“Fiserv”), and, unless the context otherwise requires, its consolidated subsidiaries.
Item 1. Business
Overview
Fiserv, Inc. is a leading global provider of payments and financial services technology solutions. We are publicly traded on the NASDAQ Global Select Market and part of the S&P 500 Index. We serve clients around the globe, including banks, credit unions, other financial institutions, corporate clients and merchants. We help clients achieve best-in-class results through a commitment to innovation and excellence in areas including account processing and digital banking solutions; card issuer processing and network services; payments; e-commerce; merchant acquiring and processing; and the Clover® cloud-based point-of-sale (“POS”) solution. Most of the services we provide are necessary for our clients to operate their businesses and are, therefore, non-discretionary in nature. We service our global client base by working among our geographic teams across various regions: the United States and Canada; Europe, Middle East and Africa; Latin America; and Asia Pacific.
In 2020, we had $14.9 billion in total revenue, $1.9 billion in operating income and $4.1 billion of net cash provided by operating activities from continuing operations. Processing and services revenue, which in 2020 represented 82% of our total revenue, is primarily generated from account- and transaction-based fees under multi-year contracts that generally have high renewal rates. We have operations and offices located both within the United States (the “U.S.” or “domestic”) and outside of the U.S. (“international”) with revenues from domestic and international products and services as a percentage of total revenue as follows for the years ended December 31: | | | | | | | | | | | | | | | | | | | | |
| | | | | | |
| (In millions) | | 2020 | | 2019 | | 2018 |
| Total revenue | | $ | 14,852 | | | $ | 10,187 | | | $ | 5,823 | |
| Domestic | | 87 | % | | 88 | % | | 94 | % |
| International | | 13 | % | | 12 | % | | 6 | % |
| | | | | | |
We have grown our business by signing new clients, expanding the products and services we provide to existing clients, offering new and enhanced products and services developed through innovation and acquisition, and extending our capabilities geographically, all of which have enabled us to deliver a wide range of integrated products and services and created new opportunities for growth. Our headquarters are located at 255 Fiserv Drive, Brookfield, Wisconsin 53045, and our telephone number is (262) 879-5000.
Effective in the first quarter of 2020, we realigned our reportable segments to reflect our new management structure and organizational responsibilities (“Segment Realignment”) following the July 2019 acquisition of First Data. Our operations are comprised of the Merchant Acceptance (“Acceptance”) segment, the Financial Technology (“Fintech”) segment and the Payments and Network (“Payments”) segment.
Acceptance
The businesses in our Acceptance segment provide a wide range of commerce-enabling solutions and serve merchants of all sizes around the world. These services include POS merchant acquiring and digital commerce services; mobile payment services; security and fraud protection products; CaratSM, our omnichannel commerce solution; and our cloud-based Clover POS platform. We distribute the products and services in the global Acceptance businesses through a variety of channels, including direct sales teams, strategic partnerships with agent sales forces, independent software vendors (“ISVs”), financial institutions, and other strategic partners in the form of joint venture alliances, revenue sharing alliances (“RSAs”), and referral agreements. Merchants, financial institutions and distribution partners in the Acceptance segment are frequently clients of our other segments.
Acceptance solutions enable businesses to securely accept consumers’ electronic payment transactions online or in-person. Payment transactions represent credit, debit, stored-value and loyalty payments, whether at a physical POS device, a mobile device such as a smart-phone or tablet, or an e-commerce transaction over the internet. Services include payment authorization; settlement; charge-back management; and solutions that secure payment data from end-to-end, including TransArmor®, our encryption, tokenization, and PCI compliance solution for data in-transit.
Omnichannel Commerce Solutions
Our Carat solution is designed to enable large merchants to offer a simple and secure payment experience to their customers across multiple channels, including accepting e-commerce payments online or in-store and enabling consumer purchasing experiences such as curbside and in-store pickup (sometimes referred to as “omnichannel”). Through a single interface with the merchant, a variety of our solutions can be integrated, including omnichannel gateway, global payments acceptance, open foreign exchange multi-currency, advanced artificial intelligence-powered authorization optimization, fraud detection, and digital payouts. By offering a variety of payment and related services via a single interface, Carat enhances the payment experience for a customer, optimizes the value and quality of transactions for the merchant, and enables pioneering payment transactions such as voice-enabled commerce and payments via the connected car.
Clover from Fiserv
Built for small and mid-sized businesses (“SMBs”), our cloud-based Clover POS platform is a comprehensive business-management solution that enables businesses to maximize their operating efficiencies, while allowing their customers to pay using a debit or credit card or via mobile payment options. The Clover platform includes hardware and software technology necessary to enable SMB merchants to accept payments, process transactions, provide online ordering, have an e-commerce presence, and generate consumer loyalty through Clover’s customer engagement tools. Clover is one of the largest open architecture platforms of commerce-enabling solutions and applications in the world. By integrating next-generation hardware and software applications, Clover has also become a leader in enabling omnichannel commerce solutions for SMBs, with touchless commerce through QR code-based payments, online ordering solutions, or a virtual terminal. Clover solutions also help small business owners gain faster access to capital through advanced access to receivables.
Distribution Channels and Partnerships
Acceptance businesses distribute solutions and services through direct sales teams, as well as partnerships with hundreds of indirect non-bank sales forces, including independent sales agents, independent sales organizations (“ISOs”), ISVs, value-added retailers (“VARs”), and payment services providers (“PSPs”). Partnerships with ISOs, ISVs, VARs and PSPs provide specialized sales capabilities and integrated merchant technology solutions to support our partners, help them grow their business and manage their portfolios. Partner technology tools enable real-time access to portfolio activity and pricing management. We also provide marketing services, data analytics and other tools that enable partners to further expand their businesses through local communities, e-commerce channels, and specific industry verticals.
In addition, the businesses in our Acceptance segment leverage powerful sales capabilities for hundreds of financial institution and non-financial institution partners to distribute their products and solutions through strategic arrangements including joint venture alliances (merchant alliances), RSAs, and referral agreements. These strategic alliances combine our commerce-enabling technology, processing capabilities and management expertise with the distribution channels, footprint and customer relationships of our partners.
Fintech
The businesses in our Fintech segment provide financial institutions around the world with the technology solutions they need to run their operations, including products and services that enable financial institutions to process customer deposit and loan accounts and manage an institution’s general ledger and central information files. As a complement to the core account processing functionality, the businesses in the global Fintech segment also provide digital banking, financial and risk management, cash management, professional services and consulting, item processing and source capture, and other products and services that support numerous types of financial transactions. Some of the businesses in the Fintech segment provide products or services to corporate clients to facilitate the management of financial processes and transactions. Many of the products and services offered in the Fintech segment are integrated with products and services provided by our other segments.
Account Processing
We provide account servicing and management technology products and services to our depository institution clients, as well as a range of integrated, value-added banking products and services. Account processing solutions enable a financial institution to operate systems that process customer deposit and loan accounts, an institution’s general ledger, central information files and other financial information. These solutions also include security, report generation and other features that financial institutions need to process transactions for their customers, as well as to facilitate compliance with applicable regulations. Although many of our clients obtain a majority of their processing requirements from us, our software design allows clients to start with one application and, as needed, add applications and features developed by us or by third parties. We support a broad range of client-owned peripheral devices manufactured by a variety of vendors, which reduce a new client’s initial conversion expenses, enhance existing clients’ ability to change technology and broaden our market opportunity.
The principal account processing solutions used by our bank clients are Cleartouch®, DNA®, Precision®, Premier® and Signature®. The principal account processing solutions primarily used by our credit union clients are CharlotteSM, CubicsPlus®, CUnify™, CUSA®, DataSafe®, DNA, Galaxy®, OnCU®, Portico®, Reliance®, Spectrum® and XP2®. The Signature and DNA solutions are available both domestically and internationally. Account processing solutions are offered primarily as an outsourced service or can be installed on client-owned computer systems or those hosted by third parties.
Our account processing business also provides consulting services, business operations services and related software products that enable the transition of check capture from branch and teller channels to digital self-service deposit channels, including mobile, merchant and ATM. Through the Fiserv® Clearing Network, we provide check clearing and image exchange services. Other products and services include image archive with online retrieval, in-clearings, exceptions and returns, statements and fraud detection.
Financial and Risk Management Solutions
Our Financial and Risk Management Solutions business provides products and services that deliver operating efficiencies and management insight that enable our clients to protect, manage and grow their businesses. Our Digital Efficiency Solutions include Frontier™ (a reconciliation product), Nautilus® (a content management product) and Prologue™ Financials, which combines enterprise performance management and financial control offerings to deliver budgeting and planning, financial accounting, and automated reconciliation and account certification tools to facilitate a robust assessment environment and efficient processes for our clients. These solutions are further complemented by fraud detection and mitigation through our Fraud and Financial Crimes Risk Management Solutions. Our Deposit Liquidity Solutions enable our clients to retain, monetize and grow their deposit account base while analyzing customer demand and providing for customer short-term liquidity. Our Commercial Payments Solutions provide financial institutions with the infrastructure they need to process, route and settle non-card-based electronic payments, including Automated Clearing House (“ACH”), wire and instant payments, and to efficiently manage associated information flows. Clients may use payment platform applications on a licensed or hosted basis, and as an add-on to existing legacy technology or as a stand-alone comprehensive modern payments platform.
Digital Channels
Our principal digital consumer and business banking products are Architect™, Corillian Online®, Corillian® Business Online, Mobiliti™, Mobiliti Business™, and SecureNow™. Our Corillian product suite supports multiple lines of banking businesses and has been designed to be highly scalable to meet the evolving needs of our clients. This structure enables our clients to deploy new services by adding and integrating applications, such as electronic bill payment, person-to-person payments and personal financial management tools, to any internet-connected point-of-presence. Our Mobiliti product suite provides a variety of mobile banking and payments services to our clients and their customers via mobile browser, downloadable application for smartphones and tablets, text message, and Amazon® Alexa® voice banking. Our Architect product suite supports online, mobile and tablet banking for retail and small business customers on a single platform. Each of these suites enables customers to complete balance inquiries, view their transaction history, make bill payments, and transfer funds between accounts and to other people. Our SecureNow product delivers real-time cybersecurity defense capability, integrates industry-leading controls into a single platform, and is pre-integrated with key Fiserv digital assets, including Corillian Online, Architect and other Fiserv platforms, for rapid deployment.
Payments
The businesses in our Payments segment provide financial institutions and corporate clients around the world with the products and services required to process digital payment transactions. This includes card transactions such as debit, credit and prepaid card processing and services; a range of network services, security and fraud protection products; card production and print services. In addition, the Payments segment businesses offer non-card digital payment software and services, including bill payment, account-to-account transfers, person-to-person payments, electronic billing, and security and fraud protection products. Clients of the global Payments segment businesses reflect a wide range of industries, including merchants, distribution partners and financial institution customers in our other segments.
Network and Debit Processing
Our network and debit processing business is a leader in electronic funds transfer services and provides a total payments solution through a variety of products and services. We provide financial institution clients with a full range of debit processing services, including ATM managed services; tokenization, loyalty and reward programs; customized authorization processing; gateway processing to payment networks; and risk management products. We own and operate the Accel®, STAR® and MoneyPass® networks, which serve financial institutions, providing access to funds at the point-of-sale and via ATMs, inclusive of CardFree CashSM access as well as via EMV® chip and traditional magnetic stripe cards. Our debit processing also provides a range of security, risk and fraud management solutions, which incorporate machine-learning-based predictive
technology, that help financial institutions securely operate and grow their business by preventing fraud. Our networks’ POS support delivers comprehensive coverage of PIN and PIN-less authentication support at physical and e-commerce merchants domestically. Our digital enablement capability provides our clients’ customers with mobile-based, customizable card management and alert tools that drive engagement and revenue for card issuers, and our risk management tools and portfolio management services are integrated with real-time fraud decisioning.
Output Solutions
Our output solutions business provides business communication products and services to clients across a wide variety of industries, including financial services, healthcare, retail, utilities, and travel and entertainment. We provide various channels for clients to communicate, build relationships and maximize customer engagement and loyalty, while limiting costs of a personalized and integrated consumer experience. Our products and services include electronic document management through our electronic document delivery products and services; card manufacturing, personalization and mailing; statement production and mailing; design and fulfillment of direct mail services; forms distribution; laser printing and mailing; and branded merchandise.
Electronic Payments
Our electronic payments business is comprised of electronic bill payment and presentment services and other electronic payment services for businesses and consumers, such as person-to-person payments, account-to-account transfers, and account opening and funding. Our principal electronic bill payment and presentment product, CheckFree® RXP®, allows our clients’ customers to: manage household bills via an easy-to-use, online tool; view billing and payment information; pay and manage all of their bills in one place; and complete same-day or next-day bill payments to a wide range of billers and others.
Our person-to-person payments and account-to-account transfer services allow consumers a convenient way to send and receive money while offering financial institutions the opportunity to generate new transaction-based revenue, attract new accounts and increase loyalty among existing customers. In addition to Popmoney®, a solution owned by Fiserv, we partner with Early Warning Services, LLC to offer a turnkey implementation of its Zelle® real-time person-to-person payments service. Our turnkey solution simplifies the implementation of Zelle by providing interface, risk management, alerting, settlement and other services to clients.
Credit Processing
Our credit processing business provides solutions to financial institutions and other issuers of credit, such as banks, group service providers, retailers and consumer finance companies, to enable them to process transactions on behalf of their customers. Depending on the market and our clients’ needs, we deliver these solutions through our proprietary outsourced services platforms, software application licenses, or software-as-a-service hosted in the cloud. Our solutions in North America use our proprietary OptisSM platform to provide transaction authorization and posting, account maintenance and settlement. Our VisionPLUSTM software is used globally as both a processing solution and a licensed software solution that enables clients to process their own transactions, depending on the market. We also provide financial institutions with professional services and customer servicing, including call center solutions and back-office processing.
Biller Solutions
Our biller business provides electronic billing and payment services to companies that deliver bills to their customers, such as utilities, telephone and cable companies, lending institutions, and insurance providers, enabling our biller clients to reduce costs, collect payments faster through multiple channels, increase customer satisfaction, and provide customers flexible, easy-to-use ways to view and pay their bills. Our clients’ customers access our electronic billing and payment systems by viewing or paying a bill through a financial institution’s bill payment application, using a biller’s website, mobile application, automated phone system or customer service representative, through www.mycheckfree.com, or by paying in-person at one of more than 30,000 nationwide walk-in payment locations operated by our agents. These diverse options allow our clients’ customers to view and pay bills wherever, whenever and however they feel most comfortable. Furthermore, because our biller clients are able to receive all of these services from us, we can eliminate the operational complexity and expense of supporting multiple vendor systems or in-house developed systems.
Prepaid Solutions
Our prepaid solutions include stored value cards offered by our Gift Solutions and Money Network® businesses. Gift Solutions provides end-to-end, omnichannel solutions to securely implement and manage gift card programs that help clients drive revenue, engagement and loyalty. These solutions include physical and digital gift card fulfillment, program management, e-commerce gift card storefronts, security and fraud protection, transaction processing services, incentive and rebate cards as well
as reloadable and non-reloadable prepaid cards that may be used with a variety of mobile applications. The Money Network service simplifies payment distribution for organizations while reducing or eliminating expenses associated with issuing traditional paper checks. This service also provides consumers without bank accounts with fast, digital access to manage their money, including wages. Money Network solutions include Electronic Payroll Delivery, digital disbursements and corporate incentives as well as single-load and reloadable prepaid account options. Accountholders of the Money Network Electronic Payroll Delivery Service have access to a Money Network Card, Money Network Checks and a robust mobile app to manage their account anytime, anywhere.
Other
Investment Services
In 2020, we sold a majority interest of our Investment Services business, subsequently renamed as Tegra118 Wealth Solutions, Inc. (“Tegra118”), which is reported within Corporate and Other following the Segment Realignment. Our remaining minority ownership interest in Tegra118 is accounted for as an equity method investment. Tegra118 provides technology products and services to financial service organizations, including broker dealers, registered investment advisors, banks, asset managers and insurance companies that deliver financial advice and managed account products to U.S. retail investors. The business’ primary product, the Unified Wealth Platform, is a real-time portfolio management, trading and reporting system used by some of the largest brokerage firms and asset managers in the U.S. offering managed accounts.
Impact of COVID-19 Pandemic
In 2019, a novel strain of coronavirus (“COVID-19”) was identified and has since continued to spread. In March 2020, the World Health Organization recognized the COVID-19 outbreak as a pandemic. In response to the COVID-19 pandemic, the governments of many countries, states, cities and other geographic regions have taken actions to prevent the spread of COVID-19, such as imposing travel restrictions and bans, quarantines, social distancing guidelines, shelter-in-place or lock-down orders and other similar limitations which adversely impacted the global economy in 2020. Additional information regarding the impact of the COVID-19 pandemic on our business can be found under the section titled “Recent Market Conditions” included within Part II, Item 7, “Management’s Discussion and Analysis of Financial Condition and Results of Operations,” of this Annual Report on Form 10-K and risks related to the COVID-19 pandemic can be found under Part I, Item 1A, “Risk Factors,” of this Annual Report on Form 10-K.
Our Strategy
Our aspiration is to move money and information in a way that moves the world. Our purpose is to deliver superior value for our clients through leading technology, targeted innovation and excellence in everything we do. We are focused on operating businesses where we have: deep industry expertise that enables us to serve the market with high effectiveness; a strong competitive position, currently or via a clear path in the foreseeable future; long-term, trusted client relationships that are based on recurring services and transactions; differentiated solutions that deliver value to our clients through integration and innovation; and strong management to execute strategies in a disciplined manner. Consistent with this focus, we continue to operate our business in accordance with the following strategic framework:
•Client Relationship Value. We plan to increase the number and breadth of our client relationships by, among other actions: continuing to integrate our products and services; introducing new products and services that are aligned with market needs; combining products and services to deliver enhanced, integrated value propositions; and improving the quality of our client service and support.
•Innovation. We seek to be an innovation leader, utilizing our assets and capabilities to be at the forefront of our industry and enable our clients to deliver best-in-class results.
•Operational Effectiveness and Integration of First Data. We believe we can further improve the quality of our client delivery while reducing our costs by using the opportunities created by our size and scale and by effectively integrating the operations of First Data. By streamlining our overall cost structure, including the rationalization of duplicate costs, we expect to meet or exceed planned cost synergies and improve the quality of products and services that we provide to our clients.
•Portfolio Management. We expect to acquire businesses when we identify: a compelling strategic need, such as a product, service or technology that helps meet client demand; an opportunity to change industry dynamics; a way to achieve business scale; or similar considerations. We expect to divest businesses that are not in line with our market, product or financial strategies.
•Capital Discipline. We intend to make capital allocation decisions that offer the best prospects for our long-term growth and profitability, which may include, among other matters, internal investment, repayment of debt, repurchases of our own shares or acquisitions.
Servicing the Market
The financial technology industry is highly dynamic, with new innovations entering the market and driving the expectations of our clients globally. The markets for our solutions have specific needs and requirements, with strong emphasis placed by clients on quality, security, service reliability, timely introduction of new capabilities and features, flexibility and value. This requires us to continue our strong emphasis on solution development to meet and exceed the specific needs of our clients. We believe that our financial strength and decades of specialized market knowledge enable us to support our clients to meet their changing preferences. In addition, we believe that our focus on quality, innovation, client service and our commitment of substantial resources to training and technical support helps us to identify and fulfill the needs of our clients.
Product Development
To meet the changing technology needs of our clients, we continually develop, maintain and enhance our products and systems. Our development and technology operations apply the expertise of multiple teams to design, develop and maintain specialized processing systems. Our products and solutions are designed to meet the preferences and diverse requirements of the international, national, regional or local market-specific merchant and financial services environments of our clients. In developing our products, we use current software development principles, such as service-oriented architecture, to create efficiencies, and we stress interaction with and responsiveness to the needs of our clients.
Resources
Our business depends on a variety of resources to operate including products and services provided to us by third parties. For example, we rely on our human capital resources for product development (including product design and coding), sales, operations (including customer service, technology support, security and compliance) and management; access to financial and telecommunication networks; computers, servers, mainframes and other data processing equipment; and Clover POS devices. We periodically review our resource requirements and sources, as well as our relationships with key vendors, to best meet the needs of our business including global sourcing efforts and alternate supplier resourcing. More information regarding our human capital resources can be found below under “Human Capital.” We believe we have access to the resources necessary for our current business needs.
Intellectual Property
We regard our software, transaction processing services and related products as proprietary, and we use a combination of patent, copyright, trademark and trade secret laws, internal security practices, employee confidentiality and assignment agreements, and third-party non-disclosure agreements to protect our intellectual property assets. Our patents cover innovations relating to numerous financial software and hardware products and services, and we continue, where appropriate, to seek and secure patents with respect to our ongoing innovations. We believe that we possess all proprietary rights necessary to conduct our business.
Competition
The market for technology products and services in the industries we serve is fragmented, highly competitive, and served by a multitude of large and small firms. Our principal competitors include other vendors and providers of financial services technology and payment systems, data processing affiliates of large companies, processing centers owned or operated as user cooperatives, financial institutions, merchant acquirers, ISOs, ISVs, payments companies and payment network operators. Our competitors also include global and local IT product and services companies and payment service providers and processors. We expect competition to continue to increase as new companies enter our markets and existing competitors expand or consolidate their product lines and services. Some of these competitors possess substantial financial, sales and marketing resources and can compete with us in various ways, including through the use of integrated product offerings and through pricing and long-standing relationships. Depending on the product or service, competitive factors may include quality, security, innovation, breadth or novelty of features and functionality, client satisfaction, market opportunity, integration, agility, global reach, multiple distribution channels, service reliability and performance standards, timely introduction of new products and features, platform scalability and flexibility, and value. We believe that we compete favorably in each of these categories. Additional information about competition in our segments is provided below.
Acceptance
Our Acceptance segment competes with merchant acquirers, including Fidelity National Information Services, Inc. (“FIS”), Global Payments Inc. (“Global Payments”), Nexi Payments S.p.A. and Wordline SA (“Worldline”), as well as with financial institutions that provide acquiring and processing services to businesses on their own, such as Paymentech, LLC, a subsidiary of JPMorgan Chase & Co.; Elavon Inc., a subsidiary of U.S. Bancorp; Barclaycard, a division of Barclays bank; and Bank of America Corporation. In many cases, our alliance and commercial partners, such as ISOs and ISVs, compete against each other. We also compete with merchant services providers like Square, Inc., Adyen N.V. and Stripe, Inc., and in Europe, our Acceptance segment also competes with a growing number of local providers who offer their services in multiple markets in the region. In addition, payment networks, such as Visa Inc. (“Visa”), Mastercard Incorporated (“Mastercard”) and American Express Company, and large technology, media and other providers are increasingly offering products and services that compete with our suite of merchant acquiring solutions.
Fintech
Our products and services in the Fintech segment compete with large, diversified software and service companies and independent suppliers of software products. Existing and potential financial institution clients could also develop and use their own in-house systems. In addition, we compete with vendors that offer similar transaction processing products and services to financial institutions, including Computer Services, Inc., Finastra Limited, FIS, Infosys Ltd., International Business Machines Corporation, Jack Henry and Associates Inc. (“Jack Henry”), NCR Corporation, Oracle Corporation, SAP SE, Global Payments, Temenos AG, Q2 Holdings, Inc. (“Q2”) and nCino, Inc.
Payments
The businesses in our Payments segment primarily compete with businesses that offer consumer payment solutions and a number of payment and card issuer processors, including ACI Worldwide, Inc., FIS, Jack Henry, Mastercard, Paymentus Corporation, PayPal Holdings, Inc., Q2, R.R. Donnelley & Sons Company, Global Payments, Visa, The Western Union Company and Wordline. In addition to traditional payments competitors, large technology, media and other emerging financial technology providers are increasingly seeking to provide alternative payment and financing solutions. Existing and potential financial institution and other corporate clients could also develop and use their own in-house systems or custom-designed solutions instead of our products and services.
Government Regulation
Our operations, and the products and services that we offer, are subject to various U.S. federal, state and local regulation, as well as regulation outside the U.S., and to other rules, such as those promulgated by various payment networks and banking authorities. Failure to comply with these rules and regulations may result in the suspension or revocation of licenses or registrations, the limitation, suspension or termination of service and/or the imposition of civil and criminal penalties, including fines. In addition, we may be required, among other things, to make significant additional investments to comply with such rules and regulations, to modify our products or services or the manner in which they are provided, or to limit or change the amount or types of revenue we are able to generate.
The Dodd-Frank Act. The Dodd-Frank Wall Street Reform and Consumer Protection Act of 2010 (“Dodd-Frank Act”) in the U.S. resulted in significant changes to the regulation of the financial services industry. Among other things, the Dodd-Frank Act established the Consumer Financial Protection Bureau (“CFPB”) which is empowered to conduct rule-making and supervision related to, and enforcement of, “federal consumer financial laws,” some of which apply to products and services offered by our clients. The CFPB conducts direct examinations of, and has issued guidance that applies to, “supervised banks and nonbanks” as well as “supervised service providers” like us. The Dodd-Frank Act also: caps debit interchange rates for certain card issuers; prohibits debit payment card networks from restricting card issuers from contracting with other payment card networks; prohibits card issuers and payment networks from restricting the ability of merchants to direct the routing of debit card transactions; requires all debit card issuers in the U.S. to participate in at least two unaffiliated debit payment card networks; and generally prohibits network exclusivity arrangements for prepaid card and healthcare debit card issuers. These regulations impact our card processing businesses and our clients’ ability to generate revenue.
Financial Institution Regulations. Because a number of our businesses provide data processing services for financial institutions, we are subject to examination by the U.S. Federal Financial Institutions Examination Council (“FFIEC”), which is a formal interagency body empowered to examine significant service providers to financial institutions. The member agencies of the FFIEC include the Federal Reserve Board, the Federal Deposit Insurance Corporation, the Office of the Comptroller of the Currency, the National Credit Union Administration, and the CFPB. We are also subject to examination by the first three of these agencies which refer to themselves as the Federal Banking Agencies when acting together. A subsidiary that engages in
certain trust activities is subject to regulation, examination, and oversight by the Division of Banking of the Colorado Department.
Under the Second Payment Services Directive (2015/2366/EC) in the European Union (“E.U.”) (PSD2), a number of our subsidiaries hold either payment institution licenses or electronic money licenses in the E.U. member states in which such subsidiaries do business. As payment institutions or electronic money institutions, those subsidiaries are subject to regulation and oversight in the applicable E.U. member states, which includes, among other obligations, a requirement to maintain specified regulatory capital. In addition, several subsidiaries outside of the U.S. provide services such as merchant terminal leasing, debit processing, acquiring, issuing, factoring and/or settlement that make them subject to regulation by financial services supervisory agencies, including the Financial Conduct Authority (“FCA”) in the United Kingdom (“U.K.”), the Federal Financial Supervision Agency in Germany, the National Bank of Poland, the Reserve Bank of Australia, and the Monetary Authority of Singapore.
Association and Network Rules. We are subject to rules of Mastercard, Visa, INTERAC, PULSE and other payment networks. In order to provide processing services, a number of our subsidiaries are registered with Visa and/or Mastercard as service providers for member institutions. A number of our subsidiaries outside the U.S. are direct members or associate members of Visa and Mastercard for purposes of conducting merchant acquiring. Various subsidiaries are also processor level members of numerous debit and electronic benefits transaction networks or are otherwise subject to various network rules in connection with processing services and other services we provide. As such, we are subject to applicable card association, network and national scheme rules that could subject us to fines or penalties. We are subject to network operating rules promulgated by Nacha relating to payment transactions processed by us using the ACH network and to various federal and state laws regarding such operations, including laws pertaining to electronic benefits transactions.
Privacy and Information Security Regulations. We provide services that are subject to various federal, state and foreign privacy laws and regulations, as well as association and network privacy rules, which govern, among other things, the collection, processing, storage, deletion, use and disclosure of personal information. These laws and rules contain a variety of obligations including the safeguarding of personal information, the provision of notices and use and disclosure rights. The regulations and rules are complex and evolving and can provide for significant penalties or the suspension or termination of our member registrations or certifications for non-compliance.
In the U.S., we are subject to various federal and state privacy and security laws. The U.S. Gramm-Leach-Bliley Act (“GLBA”) requires financial institutions to explain their information sharing practices to their customers and to safeguard sensitive data. We are subject to the GLBA and have privacy and security obligations to our clients who are regulated by the GLBA. The U.S. Health Insurance Portability and Accountability Act of 1996 (“HIPAA”), together with the HIPAA Privacy Rule, governs the use and disclosure of protected health information in healthcare treatment, payment and operations by covered entities. We have obligations under the California Consumer Privacy Act (the “CCPA”), which gives California consumers more control over the personal information businesses hold about them, as both a “business” and as a “service provider.” We are also subject to the U.S. Federal Trade Commission (“FTC”) Act, which empowers the FTC to prohibit unfair and deceptive privacy practices. In addition to the FTC Act, the FTC is also responsible for overseeing and enforcing the privacy provisions over certain aspects of the GLBA and the Fair Credit Reporting Act (“FCRA”), each of which is applicable to our businesses in certain circumstances. We are also subject to the separate security breach notification laws of each of the 50 states, the District of Columbia, Guam, Puerto Rico and the U.S. Virgin Islands.
In the E.U., we are subject to the General Data Protection Regulation (“GDPR”), a comprehensive approach to personal data protection with enforcement that can lead to penalties of up to the greater of twenty million Euro or four percent of a company’s global revenue. With the U.K.’s exit from the E.U. Single Market and Customs Union on December 31, 2020, there is uncertainty surrounding transfers of personal data from the E.U. to the U.K. There are currently transitional provisions in place stating that transfers of personal data from the E.U. to the U.K. will not be considered transfers of personal data to a third country for a transitional period of up to six months from January 1, 2021. If the transitional period ends without an appropriate resolution, transfers of personal data to the U.K. may be impacted. There are numerous additional privacy laws and regulations that apply to our businesses around the world which can provide for significant penalties. Some of these data protection laws, including the GDPR, restrict the international transfer of personal data absent lawfully recognized transfer mechanisms which can differ depending on the countries to which the data is being transferred.
Money Transmission and Payment Instrument Licensing and Regulations. We are subject to various U.S. federal, state and foreign laws and regulations governing money transmission and the issuance and sale of payment instruments, including some of our prepaid products. In the U.S., most states license money transmitters and issuers of payment instruments. Many states exercise authority over the operations of our services related to money transmission and payment instruments and, as part of this authority, subject us to periodic examinations. Many states require money transmitters, issuers of payment instruments and
their agents to comply with federal and state anti-money laundering laws and regulations and often require the licensee to maintain certain levels of net worth.
Credit Reporting and Debt Collections Regulations. TeleCheck, our check acceptance business, is subject to FCRA and various similar state laws. The collection business within our subsidiary TRS Recovery Services, Inc. (“TRS”) is subject to the U.S. federal Fair Debt Collection Practices Act and various similar state laws. TRS maintains licenses in a number of states in order to engage in collection in those states. TeleCheck and TRS are also subject to regulation, supervision and examination from the CFPB. Additional regulations may be imposed in the future, including laws regulating activities with respect to current or emerging technology such as automated dialers or pre-recorded messaging or calls to cellular phones, which could impair the collection by TRS of returned checks and those purchased under TeleCheck’s guarantee services. Moreover, reducing or eliminating access to or the use of certain information or proscribing the maintenance or use of consumer databases could reduce the effectiveness of TeleCheck’s risk management tools or otherwise increase its costs of doing business. In addition, several of our subsidiaries are subject to comparable local laws regarding collection activities and obtaining credit reports and our U.K. subsidiary described above also holds FCA licenses for debt collection activities.
Unfair Trade Practice Regulations. We and our clients are subject to various federal, state and foreign laws prohibiting unfair or deceptive trade practices. Various regulatory enforcement agencies, including the FTC and state attorneys general, have authority to take action against parties that engage in unfair or deceptive trade practices or violate other laws, rules and regulations. If we process payments for a merchant or other client in violation of laws, rules and regulations, we could be subject to enforcement actions and incur losses and liabilities that may impact our business.
Anti-Money Laundering, Anti-Bribery, and Sanctions Regulations. We are subject to anti-money laundering laws and regulations, including the Bank Secrecy Act (the “BSA”). Among other things, the BSA requires money services businesses (such as money transmitters, issuers of money orders and official checks, and providers of prepaid access) to develop and implement anti-money laundering programs. Our acquiring businesses outside the U.S. are subject to anti-money laundering laws and regulations in the countries where they operate. Our Money Network Financial, LLC subsidiary provides prepaid access for various open loop prepaid programs for which it is the program manager and therefore must meet the requirements of the Financial Crimes Enforcement Network.
We are subject to anti-corruption laws and regulations, including the U.S. Foreign Corrupt Practices Act (“FCPA”) and similar laws outside of the U.S. such as the U.K. Bribery Act, that prohibit the making or offering of improper payments to foreign government officials and political figures. The FCPA has a broad reach and requires maintenance of appropriate records and adequate internal controls to prevent and detect possible FCPA violations.
We are also subject to certain economic and trade sanctions programs that are administered by the U.S. Treasury Department’s Office of Foreign Assets Control (“OFAC”), which prohibit or restrict transactions to or from, or dealings with, specified countries, governments, individuals and entities that are specially-designated nationals of those countries, including narcotics traffickers and terrorists or terrorist organizations. Other group entities may be subject to additional local sanctions requirements in other relevant jurisdictions.
Similar anti-money laundering, counter terrorist financing and proceeds of crime laws apply to movements of currency and payments through electronic transactions and to dealings with persons specified in lists maintained by the country equivalents to OFAC lists in several other countries and require specific data retention obligations to be observed by intermediaries in the payment process. Our businesses in those jurisdictions are subject to those data retention obligations.
Communications Laws. We are subject to various federal and state laws that govern telephone calls and the issuance of text messages to clients and consumers in the U.S. as well as to regulations that impose requirements on marketing emails sent to U.S residents. Our international subsidiaries are subject to equivalent laws in applicable jurisdictions.
Indirect Regulatory Requirements. A number of our clients are subject to various regulations and compliance obligations that do not apply directly to us but impact the services that we provide to our clients. To remain competitive, we have expended, and expect to expend in the future, significant resources to develop and update our products and services to assist our clients to meet various compliance obligations. In addition, independent auditors annually review many of our operations to provide internal control evaluations for our clients and their auditors.
Human Capital
As of December 31, 2020, we had over 44,000 employees worldwide, approximately 17,000 of whom were employed outside the U.S. Successful execution of our strategy depends on attracting, developing and retaining highly qualified talent at all levels of our organization. We do this by focusing on our commitment to diversity and inclusion and employee development, retention, engagement and well-being.
Diversity and Inclusion
We are committed to cultivating a diverse, respectful and inclusive workplace. In 2020, we undertook a series of initiatives comprising our “Forward Together” plan to enhance our existing diversity and inclusion programs. Through this plan, we committed to:
•Improve diversity at all levels across the organization, including increasing the representation of women and minorities in leadership positions, requiring consideration of diverse candidates for senior leadership positions, dedicating talent acquisition resources focused on hiring diverse individuals and deepening relationships with historically Black colleges and universities, industry networks, and military and veterans’ organizations;
•Increase employee awareness through: education and participation in diversity and inclusion programs, such as inclusive leader assessment and coaching program to develop the competencies necessary to create an inclusive workplace; our Forward Together Accountability Pledge pursuant to which our senior leaders commit to advance our Forward Together plan; eight Employee Resource Groups (“ERGs”) across 10 countries for associates to connect, support each other and elevate their professional development; and a host of diversity and inclusion training courses available to all employees;
•Invest $50 million to support Black- and minority-owned small businesses through financial assistance, technology solutions, strategic partnership and subject matter expertise; and
•Strengthen partnerships with organizations focused on human rights, racial equity and social justice including work by our ERGs with community organizations and groups to provide mentorship opportunities and serve as force multipliers for talent acquisition, employee engagement and diversity efforts.
Development and Retention
We are committed to creating a high-performance culture that consistently delivers excellence for our clients and long-term value for our shareholders while providing a workplace experience for our employees that values leadership, innovation, diversity and collaboration. Our performance management process promotes differentiation based on contributions toward our strategic business objectives and overall success. Career development is an important part of our overall value proposition for employees. We provide employees with opportunities to grow, regardless of job level, within the organization including through targeted online learning, our Leading Women program designed to accelerate the professional growth of female top talent, our Leading Fiserv program designed to develop critical leadership skills for frontline managers, and our Vision to Results leadership program focused on driving our One Fiserv approach to enterprise goals. We also focus on internal mobility and redeployment to ensure we provide talented employees the best opportunity for internal success while retaining their skill sets.
Engagement
To assess employee engagement, we seek and collect employee feedback through our annual Your Voice employee engagement survey, distributed to all associates worldwide. The survey focuses on the following categories: Engagement; Manager Effectiveness; Client Experience; Trust; Diversity and Inclusion; Communication and Teamwork; and Well-Being. More than 90% of our associates responded to the survey in 2020. Our engagement scores improved over the prior year and were higher than the comparable average benchmarks, most landing in the top decile of companies surveyed. These results are particularly notable given that the survey was completed in the midst of driving a transformational corporate integration and the global COVID-19 pandemic, which manifested in most of our associates working remotely. In addition to assessing engagement, the survey results enable us to gain insight into employee perspectives and issues which we use to enhance processes, set priorities and respond quickly to associate concerns.
Well-Being and Safety
We are focused on delivering a comprehensive and competitive benefits offering as part of our total rewards strategy. We provide associates with access to a holistic suite of well-being programs and benefits focused on physical, financial, social and emotional resources. These programs are supported by complementary policies such as paid parental and military service leave policies.
In response to the COVID-19 pandemic, we have taken a number of actions to protect the health, safety and well-being of our employees while continuing to serve our clients. These actions include, among others, requiring most of our employees to work
remotely, suspending non-essential travel, suspending all non-essential visitors to our facilities, disinfecting facilities and workspaces extensively and frequently, providing personal protective equipment to employees and requiring employees who must be present at our facilities to adhere to a variety of safety protocols. We expanded paid time-off for employees impacted by COVID-19, provided increased pay for certain employees involved in critical infrastructure who could not work remotely, and expanded our Fiserv Cares program to benefit employees in need around the world. We expect to continue such safety and wellness measures for the foreseeable future and may take further actions, or adapt these existing policies, as government authorities may require or recommend or as we may determine to be in the best interest of our employees, clients, vendors and shareholders.
Available Information
Our website address is www.fiserv.com. We are not including the information provided on our website as a part of, or incorporating it by reference into, this Annual Report on Form 10-K. We make available free of charge (other than an investor’s own internet access charges) through our website our annual reports on Form 10-K, quarterly reports on Form 10-Q, current reports on Form 8-K, and amendments to these reports, as soon as reasonably practicable after we electronically file such material with, or furnish such material to, the Securities and Exchange Commission.
Item 1A. Risk Factors
You should carefully consider each of the risks described below, together with all of the other information contained in this Annual Report on Form 10-K, before making an investment decision with respect to our securities. If any of the following risks develop into actual events, our business, results of operations or financial condition could be materially and adversely affected, and you may lose all or part of your investment.
Competitive and Business Risks
We operate in a competitive business environment and may not be able to compete effectively.
The markets for our products and services are highly competitive from new and existing competitors. Our principal competitors include other vendors and providers of financial services technology and payment systems, data processing affiliates of large companies, processing centers owned or operated as user cooperatives, financial institutions, independent sales organizations (“ISOs”), independent software vendors, payments companies and payment network operators. Our competitors vary in size and in the scope and breadth of the services they offer. Many of our larger existing and potential clients have historically developed their key applications in-house. As a result, we may compete against our existing or potential clients’ in-house capabilities. In addition, we expect that the markets in which we compete will continue to attract new technologies and well-funded competitors, including large technology, telecommunication, media and other companies not historically in the financial services and payments industries, start-ups and international providers of products and services similar to ours. In addition, participants in the financial services, payments and technology industries may merge, create joint ventures or engage in other business combinations, alliances and consolidations that may strengthen their existing business services or create new payment services that compete with our services. We cannot provide any assurance that we will be able to compete successfully against current or future competitors or that competitive pressures faced by us in the markets in which we operate will not materially and adversely affect our business, results of operations and financial condition.
If we fail to keep pace with technological change, we could lose clients or have trouble attracting new clients, and our ability to grow may be limited.
The markets for our products and services are characterized by constant and rapid technological change, frequent introduction of new products and services, and increasing client expectations. Our ability to enhance our current products and services and to develop and introduce innovative products and services will significantly affect our future success. We may not be successful in developing, marketing or selling new products and services that meet these demands or achieve market acceptance. We must anticipate and respond to these changes in order to remain competitive within our relevant markets. For example, our ability to provide innovative point-of-sale technology to our merchant clients could have an impact on our merchant acquiring business, and new services and technologies that we develop may be impacted by industry-wide solutions and standards related to tokenization or other safety, fraud prevention and security technologies. If we are unable to anticipate or respond to technological changes or evolving industry standards on a timely basis, our ability to remain competitive could be materially adversely affected. In addition, the success of certain of our products and services rely, in part, on financial institutions, corporate and other third parties to promote the use of our products and services by their customers. If we are unsuccessful in offering products or services that gain market acceptance and compete effectively, or if third parties insufficiently promote our products and services, it would likely have a material adverse effect on our ability to retain existing clients, to attract new ones and to grow profitably.
If we are unable to renew client contracts at favorable terms, we could lose clients and our results of operations and financial condition may be adversely affected.
Failure to achieve favorable renewals of client contracts could negatively impact our business. At the end of the contract term, clients have the opportunity to renegotiate their contracts with us or to consider whether to engage one or more of our competitors to provide products and services or to perform the services in-house. Some of our competitors may offer more attractive prices, features or other services that we do not offer, and some clients may desire to perform the services themselves. Larger clients may be able to seek lower prices from us when they renew or extend a contract or the client’s business has significant volume changes. In addition, larger clients may reduce the services we provide if they decide to move services in-house. Further, our small merchant business clients may seek reduced fees due to pricing competition, their own financial condition, or pressures from their customers. On some occasions, these factors result in lower revenue from a client than we had anticipated based on our previous agreement with that client. If we are not successful in achieving high renewal rates and favorable contract terms, our results of operations and financial condition may be materially and adversely affected.
Our business depends, in part, on our merchant relationships and alliances, and if we are unable to maintain these relationships and alliances, our business may be adversely affected.
Under our alliance program, a bank or other institution forms an alliance with us, generally on an exclusive basis, either contractually or through a separate legal entity. Merchant contracts may be contributed to the alliance by us and/or the bank or institution. The banks and other institutions generally provide card association sponsorship, clearing and settlement services and typically act as a merchant referral source when the institution has an existing banking or other relationship with such merchant. We provide transaction processing and related functions to the alliance. Both we and our alliance partners may also provide management, sales, marketing and other administrative services. The alliance structure allows us to be the processor for multiple financial institutions, any one of which may be selected by the merchant as its bank partner. Our merchant acquiring business depends, in part, on our merchant relationships, alliances and other distribution channels. There can be no guarantee that we will achieve growth in our merchant relationships, alliances or other distribution channels. In addition, our contractual arrangements with merchants and merchant alliance partners are for fixed terms and may allow for early termination upon the occurrence of certain events. There can be no assurance that we will be able to renew our contractual arrangements with these merchants or merchant alliance partners on similar terms or at all. The loss of merchant relationships or alliance partners could negatively impact our business and have a material adverse effect on our results of operations and financial condition.
Changes in card association and debit network fees or products could increase costs or otherwise limit our operations.
From time to time, card associations and debit networks, including the card networks which we own and operate, increase the processing and other fees (including what is commonly called “interchange fees”) that they charge. It is possible that competitive and other pressures will result in us absorbing a portion of such increases in the future, or not being able to increase our own fees, which would increase our operating costs, reduce our profit margin, limit our growth, and adversely affect our business, results of operations and financial condition. In addition, the various card associations and networks prescribe certain capital requirements. Any increase in the capital level required would further limit our use of capital for other purposes.
Consolidations in the banking and financial services industry could adversely affect our revenue by eliminating existing or potential clients and making us more dependent on fewer clients.
Mergers, consolidations and failures of financial institutions reduce the number of our clients and potential clients, which could adversely affect our revenue. If our clients merge with or are acquired by other entities that are not our clients, or that use fewer of our services, they may discontinue or reduce their use of our services. Our alliance strategy could also be negatively affected by consolidations, especially where the financial institutions involved are committed to their internal merchant processing businesses that compete with us. It is also possible that the larger financial institutions that result from mergers or consolidations could have an increased ability to negotiate terms with us or could decide to perform in-house some or all of the services which we currently provide or could provide. Any of these developments could have a material adverse effect on our business, results of operations and financial condition.
Operational and Security Risks
Security incidents or other technological risks involving our systems and data, or those of our clients, partners or vendors, could expose us to liability or damage our reputation.
Our operations depend on receiving, storing, processing and transmitting sensitive information pertaining to our business, our employees, our clients and their customers. Under the card network rules, various federal, state and international laws, and client contracts, we are responsible for information provided to us by financial institutions, merchants, ISOs, third-party service providers and others. The confidentiality of such sensitive business information and personal consumer information residing on
our systems is critical to our business. Any unauthorized access, intrusion, infiltration, network disruption, denial of service or similar incident could disrupt the integrity, continuity, security and trust of our systems or data, or the systems or data of our clients, partners or vendors. These incidents are often difficult to detect and are constantly evolving. We expect that unauthorized parties will continue to attempt to gain access to our systems or facilities, and those of our clients, partners and vendors, through various means and with increasing sophistication. These events could create costly litigation, significant financial liability, increased regulatory scrutiny, financial sanctions and a loss of confidence in our ability to serve clients and cause current or potential clients to choose another service provider, all of which could have a material adverse impact on our business. In addition, we expect to continue to invest significant resources to maintain and enhance our information security and controls or to investigate and remediate any security vulnerabilities. Although we believe that we maintain a robust program of information security and controls and that none of the events that we have encountered to date have materially impacted us, we cannot be certain that the security measures and procedures we have in place to detect security incidents and protect sensitive data, including protection against unauthorized access and use by our employees, will be successful or sufficient to counter all current and emerging technological risks and threats. The impact of a material event involving our systems and data, or those of our clients, partners or vendors, could have a material adverse effect on our business, results of operations and financial condition.
Operational failures and resulting interruptions in the implementation or availability of our products or services could harm our business and reputation.
Our business depends heavily on the reliability of our processing and other systems. An operational failure and the resulting implementation delays or service interruption could harm our business or cause us to lose clients. An operational failure could involve the hardware, software, data, networks or systems upon which we rely to deliver our services and could be caused by our actions, the actions of third parties or events over which we may have limited or no control. Events that could cause operational failures include, but are not limited to, hardware and software defects or malfunctions, computer denial-of-service and other cyberattacks, human error, earthquakes, hurricanes, floods, fires, natural disasters, pandemics, power losses, disruptions in telecommunications services, fraud, military or political conflicts, terrorist attacks, computer viruses or other malware, or other events. In the event of operational failures or damage or disruption to our business due to these occurrences, we may not be able to successfully or quickly recover all of our critical business functions, assets and data through our business continuity program. Implementation delays, interruptions of service or hardware device defects could damage our relationship with clients and could cause us to incur substantial expenses, including those related to the payment of service credits, product recalls or other liabilities. A prolonged interruption of our services or network could cause us to experience data loss or a reduction in revenue, and significantly impact our clients’ businesses and the customers they serve. In addition, a significant implementation delay, interruption of service or product recall could have a negative impact on our reputation and could cause our current and potential clients to choose another service provider. As a provider of payments solutions and other financial services, clients, regulators and others may require specific business continuity and disaster recovery plans including frequent testing of such plans. Meeting these various requirements may require a significant investment of time and money. Any of these developments could have a material adverse impact on our business, results of operations and financial condition.
Disruptions of operations of other participants in the global financial system could prevent us from delivering our products and services.
The operations and systems of many participants in the global financial system are interconnected. Many of the transactions involving our products and services rely on multiple participants in the global financial system to move funds and communicate information to the next participant in the transaction chain. A disruption for any reason of the operations of a participant in the global financial system could impact our ability to obtain or provide information or cause funds to be moved in a manner to successfully deliver our products and services. Although we work with other participants to avoid any disruptions, there is no assurance that such efforts will be effective. Such a disruption could lead to our inability to deliver products and services, reputational damage, lost clients and revenue, loss of clients’ and their customers’ confidence, as well as additional costs, all of which could have a material adverse effect on our business, results of operations and financial condition.
We rely on third parties to provide products and services and if we are unable to obtain such products or services in the future or if these third parties fail to perform these services adequately, our business may be materially and adversely affected.
We rely on third parties we do not control to provide us with products and services, including payment card networks, acquiring processors, payment card issuers, financial institutions and the Automated Clearing House (“ACH”) network which transmit transaction data, process chargebacks and refunds, and perform clearing services in connection with our settlement activities. If, for example, such third parties stop providing clearing services or limit our volumes, we would need to find other financial institutions to provide those services. In the event these third parties fail to provide these services adequately or in a timely manner, including as a result of errors in their systems or events beyond their control, or refuse to provide these services on
terms acceptable to us or at all, and we are not able to find timely suitable alternatives, we may no longer be able to provide certain services to customers, which could expose us and our clients to information security, financial, compliance and reputational risks, among others, and have a material adverse effect on our results of operations and financial condition. In addition, if we are unable to renew our existing contracts with key vendors and service providers, we might not be able to replace the related product or service at all or at the same cost, which would negatively impact our results of operations.
We may experience software defects, development delays or installation difficulties, which would harm our business and reputation and expose us to potential liability.
Our services are based on sophisticated software and computer systems and we may encounter delays when developing new applications and services. Further, the software underlying our services may contain undetected errors or defects when first introduced or when new versions are released. We may also experience difficulties in installing or integrating our technology on systems or with other programs used by our clients. Defects in our software, errors or delays in the processing of electronic transactions or other difficulties could result in interruption of business operations, delay in market acceptance, additional development and remediation costs, diversion of technical and other resources, loss of clients or client data, negative publicity or exposure to liability claims. Although we attempt to limit our potential liability through disclaimers and limitation of liability provisions in our license and client agreements, we cannot be certain that these measures will successfully limit our liability.
COVID-19 Pandemic Risks
Our business has been, and is likely to continue to be, adversely impacted by the coronavirus (COVID-19) pandemic.
In response to the COVID-19 pandemic, the governments of many countries, states, cities and other geographic regions have taken actions to prevent the spread of COVID-19, such as imposing travel restrictions and bans, quarantines, social distancing guidelines, shelter-in-place or lock-down orders and other similar limitations. These measures have, among other matters, negatively impacted consumer and business spending and, as a result, our operating performance, primarily within our merchant acquiring and payment-related businesses, which earn transaction-based fees. The pandemic may continue to negatively impact transaction volumes, create economic uncertainty and financial market volatility, reduce economic activity, increase unemployment and cause a decline in consumer and business confidence, and could in the future further negatively impact the demand for our products and services, including merchant acquiring and payment processing. Ultimately, the extent of the impact of the COVID-19 pandemic on our future operational and financial performance will depend on, among other matters, the duration and intensity of the pandemic; the level of success of global vaccination efforts; governmental and private sector responses to the pandemic and the impact of such responses on us; and the impact of the pandemic on our employees, clients, vendors, operations and sales, all of which are uncertain and cannot be predicted.
Additional factors that could negatively impact us include:
•Payment processing risks associated with disruptions to merchant activity and business failures including chargeback risk. As an unprecedented number of merchants have been required to suspend or terminate their operations, there may be an increase in consumer chargebacks associated with processed transactions that merchant clients have submitted but have not fulfilled. Merchants may be unable to fund these chargebacks, potentially resulting in losses to us;
•Client payment risks. Clients may require additional time to pay us or fail to pay us at all, which could significantly increase the amount of accounts receivable and require us to record additional allowances for doubtful accounts. If clients cease operations or file for bankruptcy protection, we may experience lower revenue and earnings and have greater exposure to future transaction declines;
•Increased cyber and payment fraud risk, as cybercriminals attempt to profit from the disruption given increased online banking, e-commerce and other online activity;
•Disruption to our supply chain and third-party delivery service providers, including if the factories that manufacture our point-of-sale devices are temporarily closed or experience workforce shortages, if shipping services are interrupted or delayed, or if there are workforce shortages at our or third-party customer support, software development or technology hosting facilities;
•Increased risk of failing to meet client contractual obligations, including due to government orders or other restrictions that limit or prohibit us from providing client-facing services from regular service locations or the failure of our business continuity plans, which could cause loss of revenue, contractual penalties or potential legal disputes and associated costs; and
•Challenges to the availability and reliability of our solutions and services due to changes to normal operations, including the possibility of one or more clusters of COVID-19 cases occurring at our data, call or operations centers,
affecting our employees or affecting the systems or employees of our clients or other third parties on which we depend.
The COVID-19 pandemic has caused us to modify our business practices, including requiring a majority of our employees to work remotely, suspending non-essential travel, suspending all non-essential visitors to our facilities, disinfecting facilities and workspaces extensively and frequently, providing personal protective equipment to associates and requiring employees who must be present at our facilities to adhere to a variety of safety protocols. We expect to continue such safety measures for the foreseeable future and may take further actions, or adapt these existing policies, as government authorities may require or recommend or as we may determine to be in the best interest of our employees, clients and vendors. Such measures may impact our productivity or effectiveness, and there is no certainty that such measures will be sufficient to mitigate the risks posed by the COVID-19 pandemic, including the risks to the health of our employees. Further, the ability of our employees to get to work has been disrupted across multiple locations, both with respect to their own offices and client sites, due among other things to government work and travel restrictions, including mandatory shutdowns.
In response to the COVID-19 pandemic, federal, state, local and foreign governments have issued emergency orders and a significant number of new laws and regulations in a short period of time. These actions have impacted our current operations, including with respect to collection and consumer credit reporting activities, and we have experienced an increased volume of client support requests because many of the new laws impact our clients. We could be required to expend additional resources and incur additional costs to address regulatory requirements applicable to us or our clients, and we may not have the capacity to implement necessary changes within the times prescribed by applicable laws. There could be government initiatives to reduce or eliminate payments, costs or fees to merchants, or fees or other sources of revenue to financial institutions. Regulations may be unclear, difficult to interpret or in conflict with other applicable regulations. As a result, we may have to make judgments about how to comply with these new laws and regulators may not ultimately agree with how we implement applicable regulations. Failure to comply with any of these laws and regulations, including changing interpretations and the implementation of new, varying or more restrictive laws and regulations by federal, state, local or foreign governments, may result in financial penalties, lawsuits, reputational harm or change the manner in which we or our clients currently conduct some aspects of our business. In addition, during times of economic stress, there tends to be greater regulatory and governmental scrutiny of actions taken in response to such stress and an increased risk of both governmental and third-party litigation.
A lack of further recovery or deterioration in economic and market conditions resulting from the COVID-19 pandemic could negatively impact our ability to generate earnings and cash flows sufficient to service debt and meet lease and other obligations as they come due or to meet our financial debt covenants. The pandemic could also make obtaining financing more difficult or expensive, and our ability to access the long-term debt markets on favorable interest rate and other terms will depend on market conditions and the ratings assigned by the credit rating agencies to our indebtedness.
There are no comparable recent events that provide guidance as to the impacts the COVID-19 pandemic may continue to have, and, as a result, the ultimate impacts are highly uncertain and subject to change. The extent to which the pandemic or any resulting worsening of the global business and economic environment adversely impacts our business, results of operations, liquidity and financial condition will depend on future developments, which are highly uncertain and are difficult to predict, including, but not limited to, the duration and intensity of the COVID-19 pandemic, the actions taken to contain or limit the pandemic, including whether vaccination efforts are successful, and how quickly and to what extent pre-pandemic economic and operating conditions can resume. These factors may remain prevalent for a significant period of time even after the pandemic subsides, including due to a continued or prolonged recession in the U.S. or other major economies. The impacts of the COVID-19 pandemic could have a material adverse effect on our business, results of operations, liquidity or financial condition and heighten or exacerbate risks described in this Annual Report on Form 10-K.
Global Market Risks
Our business may be adversely affected by geopolitical and other risks associated with operations outside of the U.S. and, as we continue to expand internationally, we may incur higher than anticipated costs and may become more susceptible to these risks.
We offer merchant acquiring, processing and issuing services outside of the U.S., including in the U.K., Germany, Argentina, India and Brazil. Our facilities outside of the U.S., and those of our suppliers and vendors, including manufacturing, customer support, software development and technology hosting facilities, are subject to risks, including natural disasters, public health crises, political crises, terrorism, war, political instability and other events outside of our or our suppliers’ control. As we expand internationally and grow our client base outside of the U.S., we may face challenges due to the presence of more established competitors and our lack of experience in such non-U.S. markets, and we may incur higher than anticipated costs. If we are unable to successfully manage the risks associated with the international operation and expansion of our business, our results of operations and financial condition could be negatively impacted.
The United Kingdom’s withdrawal from the European Union Single Market and Customs Union as part of the process known as “Brexit” could adversely affect our results of operations.
Effective December 31, 2020, the U.K. left the E.U. Single Market and Customs Union and also ceased to be subject to international agreements the E.U. is a party to. On December 24, 2020, the E.U. and the U.K. agreed to the terms of a trade and cooperation agreement which sets out the terms of their future relationship (the “Trade Agreement”). As a result, and subject to the terms of the Trade Agreement, the rules of the E.U. Single Market and Customs Union relating to the free movement of persons, goods, services and capital between the U.K. and the E.U. ended, and the E.U. and the U.K. formed two separate markets and two distinct regulatory and legal spaces. Brexit may, among other outcomes, and subject to the terms of the Trade Agreement, disrupt the free movement of goods, services, data and people between the U.K. and the E.U., undermine bilateral cooperation in key policy areas, and significantly disrupt trade between the U.K. and the E.U. In addition, Brexit may lead to legal uncertainty and potentially divergent national laws and regulations as the U.K. determines, going forward and subject to the terms of the Trade Agreement, which E.U. laws and regulations to maintain and which to amend or replace. The effects of Brexit will depend in part on any agreements, in addition to the Trade Agreement, which the E.U. and the U.K. reach to allow the U.S. and the E.U. to retain access to each other’s markets in areas not covered by the Trade Agreement.
The Trade Agreement offers U.K. and E.U. businesses preferential access to each other’s markets, ensuring imported goods will be free of tariffs and quotas. However, economic relations between the U.K. and the E.U. will now be on more restricted terms than existed previously. The Trade Agreement does not incorporate the full scope of the services sector, and businesses such as banking and finance face a more uncertain future. The U.K. and E.U. plan to put in place a regulatory dialogue on financial services based on a separate memorandum of understanding (“MoU”). Talks on the MoU are expected to begin by March 2021. At this time, we cannot predict the impact that the Trade Agreement and any future agreements on services, including the MoU, will have on our business and our clients, and it is possible that the terms of any new agreements (or a failure to reach such agreements) may adversely affect our operations and financial results. Given the lack of comparable precedent, it is unclear what financial, trade and legal implications the withdrawal of the U.K. from the E.U. will have and how such withdrawal will affect us.
In addition, Brexit may create additional uncertainty in currency exchange rate fluctuations that may result in the strengthening of the U.S. dollar against foreign currencies in which we conduct business. We translate revenue denominated in foreign currency into U.S. dollars for our financial statements. During periods of a strengthening U.S. dollar, our reported international revenue and profit is reduced because foreign currencies translate into fewer U.S. dollars. Any of these effects of Brexit, among others, could materially adversely affect our relationships with our existing and future clients and vendors, which could have an adverse effect on our business, results of operations and business opportunities.
Our business may be adversely impacted by U.S. and global market and economic conditions.
For the foreseeable future, we expect to continue to derive revenue primarily from products and services we provide to the financial services industry and our merchant acquiring business. Given this focus, we are exposed to global economic conditions and adverse economic trends may accelerate the timing, or increase the impact of, risks to our financial performance. Such trends may include, but are not limited to, the following:
•declining economies, foreign currency fluctuations, social unrest, natural disasters, public health crises, including the occurrence of a contagious disease or illness, and the pace of economic recovery can change consumer spending behaviors, such as cross-border travel patterns, on which a significant portion of our revenues are dependent;
•low levels of consumer and business confidence typically associated with recessionary environments and those markets experiencing relatively high inflation and/or unemployment, may cause decreased spending by cardholders;
•budgetary concerns in the U.S. and other countries around the world could affect the U.S. and other specific sovereign credit ratings, impact consumer confidence and spending, and increase the risks of operating in those countries;
•emerging market economies tend to be more volatile than the more established markets we serve in the U.S. and Europe, and adverse economic trends, including high rates of inflation, may be more pronounced in such emerging markets;
•financial institutions may restrict credit lines to cardholders or limit the issuance of new cards to mitigate cardholder defaults;
•uncertainty and volatility in the performance of our clients’ businesses may make estimates of our revenues, rebates, incentives, and realization of prepaid assets less predictable;
•our clients may decrease spending for value-added services; and
•government intervention, including the effect of laws, regulations, and/or government investments in our clients, may have potential negative effects on our business and our relationships with our clients or otherwise alter their strategic direction away from our products.
A weakening in the economy or competition from other retailers could also force some retailers to close, resulting in exposure to potential credit losses and declines in transactions, and reduced earnings on transactions due to a potential shift to large discount merchants. Additionally, credit card issuers may reduce credit limits and become more selective in their card issuance practices.
A prolonged poor economic environment could result in significant decreases in demand by current and potential clients for our products and services and in the number and dollar amount of transactions we process or accounts we service, which could have a material adverse effect on our business, results of operations and financial condition.
Potential tariffs or trade wars could increase the cost of our products, which could adversely impact the competitiveness of our products and our financial results.
The U.S. has imposed tariffs on certain imports from China, including on some of our hardware devices manufactured in China. If the U.S. administration imposes additional tariffs, or if additional tariffs or trade restrictions are implemented by the U.S. or other countries, our hardware devices produced in China could be impacted. Although it is difficult to predict how current or future tariffs on items imported from China or elsewhere will impact our business, the cost of our products manufactured in China and imported into the U.S. or other countries could increase, which in turn could adversely affect the demand for these products and have a material adverse effect on our business and results of operations.
Regulatory and Compliance Risks
If we or third parties with whom we partner or contract fail to comply with applicable laws and regulations, we could be subject to liability and our business could be harmed.
If we or third parties with whom we partner or contract fail to comply with laws and regulations applicable to our business, including state and federal payment, cybersecurity, consumer protection, trade and data privacy laws and regulations, we could be exposed to litigation or regulatory proceedings, our client relationships and reputation could be harmed, and our ability to obtain new clients could be inhibited, which could have a material adverse impact on our business, results of operations and financial condition. Our clients are also subject to numerous laws and regulations applicable to banks, financial institutions and card issuers in the U.S. and abroad, and, consequently, we are at times affected by these federal, state, local and foreign laws and regulations. These laws and regulations are subject to frequent change, with new laws, regulations and interpretations thereof being implemented.
Certain of our subsidiaries are licensed as money transmitters and are required, among other matters, to demonstrate and maintain certain levels of net worth and liquidity and to file periodic reports. Our direct-to-consumer payments businesses are subject to state and federal regulations in the U.S., including state money transmission regulations, anti-money laundering regulations, economic and trade sanctions administered by the U.S. Treasury Department’s Office of Foreign Asset Control (“OFAC”) and certain privacy regulations, such as the U.S. Gramm-Leach-Bliley Act. Our Money Network Financial, LLC subsidiary provides prepaid access for various open loop prepaid programs for which it is the program manager and therefore must meet the requirements of the Financial Crimes Enforcement Network. We also have businesses that are subject to credit reporting and debt collection laws and regulations in the U.S. In addition, certain of our subsidiaries are subject to, among others, privacy, anti-money laundering, debt collection, and payment institution or electronic money licensing regulations outside the U.S.
We operate our business around the world, including in certain foreign countries with developing economies where companies often engage in business practices that are prohibited by laws applicable to us, including the U.S. Foreign Corrupt Practices Act and the U.K. Bribery Act. These laws prohibit, among other things, improper payments or offers of payments to foreign governments and their officials and political parties for the purpose of obtaining or retaining business. We have implemented policies and training programs to discourage such practices; however, there can be no assurance that all of our employees, consultants and agents will comply with our policies and all applicable laws.
We are also subject to certain economic and trade sanctions programs, including those that are administered by OFAC, which prohibit or restrict transactions to or from, or dealings with, specified countries, their governments, individuals and entities that are specially-designated nationals of those countries, narcotics traffickers and terrorists or terrorist organizations. Similar anti-money laundering, counter terrorist financing and proceeds of crime laws apply to movements of currency and payments through electronic transactions and to dealings with persons specified in lists equivalent to OFAC lists in several other countries
and require specific data retention obligations to be observed by intermediaries in the payment process. Our businesses in those jurisdictions are subject to those data retention obligations.
The volume and complexity of these regulations will continue to increase our cost of doing business. Failure to comply with these laws and regulations, or changes in the regulatory environment, including changing interpretations and the implementation of new, varying or more restrictive laws and regulations by federal, state, local or foreign governments, may result in significant financial penalties, reputational harm, suspension or termination of our ability to provide certain services, or change or restrict the manner in which we currently conduct our business, all of which could have a material adverse impact on our business, results of operations and financial condition.
If we fail to comply with the applicable requirements of the payment card networks and Nacha, they could seek to fine us, suspend us or terminate our registrations, which could adversely affect our business.
In order to provide our transaction processing services, several of our subsidiaries are registered with Visa and Mastercard and other networks as members or service providers for member institutions. A number of our subsidiaries outside the U.S. are direct members or associate members of Visa and Mastercard for purposes of conducting merchant acquiring, and various subsidiaries are also processor level members of numerous debit and electronic benefits transaction networks. As such, we are subject to card association and network rules that could subject us or our clients to a variety of fines or penalties that may be levied by the card associations or networks for certain acts or omissions by us, acquiring clients, processing clients or merchants. In addition, we are subject to Nacha rules relating to payment transactions processed by us using the ACH network and to various federal and state laws regarding such operations, including laws pertaining to electronic benefits transactions, as well as the Payment Card Industry Data Security Standard enforced by the major card brands. The rules of Nacha and the card networks are set by their respective boards, some of which are our competitors, and the card network rules may be influenced by card issuers, some of which offer competing transaction processing services.
If we fail to comply with these rules, we could be fined and our member registrations or certifications could be suspended or terminated. The suspension or termination of our member registrations or certifications, or any changes to the association and network rules, that we do not successfully address, or any other action by the card networks to restrict our ability to process transactions over such networks, could limit our ability to provide transaction processing services to clients and result in a reduction of revenue or increased costs of operation, which, in either case, could have a material adverse effect on our business and results of operations.
A heightened regulatory environment in the financial services industry may have an adverse impact on our clients and our business.
Since the enactment of the Dodd-Frank Wall Street Reform and Consumer Protection Act (“Dodd-Frank Act”), a number of substantial regulations affecting the supervision and operation of the financial services industry within the U.S. have been adopted, including those that establish the Consumer Financial Protection Bureau (“CFPB”). The CFPB has issued guidance that applies to, and conducts direct examinations of, “supervised banks and nonbanks” as well as “supervised service providers” like us. In addition, the CFPB regulates consumer financial products and services (including many offered by our clients), restricts debit card fees paid by merchants to certain issuer banks and allows merchants to offer discounts for different payment methods. CFPB rules, examinations and enforcement actions may require us to adjust our activities and may increase our compliance costs. Changes to the Dodd-Frank Act or regulations could adversely impact our debit network business. In addition, certain of our alliance partners are subject to regulation by federal and state authorities and, as a result, could pass through some of those compliance obligations to us.
To the extent this oversight or regulation negatively impacts the business, operations or financial condition of our clients, our business and results of operations could be materially and adversely affected because, among other matters, our clients could have less capacity to purchase products and services from us, could decide to avoid or abandon certain lines of business, or could seek to pass on increased costs to us by negotiating price reductions. Additional regulation, examination and oversight of us could require us to modify the manner in which we contract with or provide products and services to our clients; directly or indirectly limit how much we can charge for our services; require us to invest additional time and resources to comply with such oversight and regulations; or limit our ability to update our existing products and services, or require us to develop new ones. Any of these events, if realized, could have a material adverse effect on our business, results of operations and financial condition.
Legislative or regulatory initiatives on cybersecurity and data privacy could adversely impact our business and financial results.
Cybersecurity and data privacy risks have received heightened legislative and regulatory attention. For example, the General Data Protection Regulation (“GDPR”) extends the scope of the E.U. data protection law to all companies processing data of
E.U. residents, regardless of the company’s location, subject to certain limitations. The law requires companies to meet stringent requirements regarding the handling of personal data. E.U. data protection law continues to develop and require significant changes to our policies and procedures. In July 2020, the Court of Justice of the European Union issued a decision in the case Data Protection Commissioner v. Facebook Ireland Limited, and Maximillian Schrems (the “Schrems II Decision”) that invalidated the European Commission’s adequacy decision for the E.U.-U.S. Privacy Shield Framework and placed additional safeguards necessary for transfers of personal data to the U.S., requiring companies and regulators to conduct case-by-case analyses to determine whether foreign protections concerning government access to transferred data meet E.U. standards. Our vendors and clients have been directly impacted by the Schrems II Decision, and our ability to transfer data outside the E.U. may be further impacted by the Schrems II Decision and determinations made by regulators in the E.U. We do not yet know the extent of this impact on our operations. We, along with our vendors and customers, rely on Standard Contractual Clauses (“SCCs”) to transfer data out of the E.U. If the European Commission requires that new SCCs be signed to replace the existing SCCs, we will need to devote resources to entering into the appropriate SCCs to continue to engage in transfers of data as applicable. In addition, with the U.K.’s exit from the E.U. Single Market and Customs Union on December 31, 2020, there is uncertainty surrounding transfers of personal data from the E.U. to the U.K. The Trade Agreement provides that transfers of personal data from the E.U. to the U.K. will not be considered transfers of personal data to a third country during a transitional period of up to six months from January 1, 2021. If the transition period ends without an appropriate resolution, transfers of personal data from the E.U. to the U.K. may be impacted.
Our efforts to comply with E.U., U.K. and other privacy and data protection laws (such as the California Consumer Privacy Act, the California Privacy Rights Act taking effect in January 2023, the Brazilian General Data Protection Law and South Africa’s Protection of Personal Information Act) could involve substantial expenses, divert resources from other initiatives and projects and limit the services we are able to offer. Further, failure to comply with applicable laws in this area could also result in fines, penalties and reputational damage.
In addition, U.S. banking agencies have proposed enhanced cyber risk management standards that would apply to us and our financial institution clients and that would address cyber risk governance and management, management of internal and external dependencies, and incident response, cyber resilience and situational awareness. Several states also have adopted or proposed cybersecurity laws targeting these issues, including the New York Cybersecurity Requirements for Financial Services Companies and the New York Shield Act to protect personal and private data. New York and Washington state have each proposed comprehensive privacy acts to govern the personal data of their residents. The U.S. government has also proposed federal privacy legislation. Legislation and regulations on cybersecurity, data privacy and data localization may compel us to enhance or modify our systems, invest in new systems or alter our business practices or our policies on data governance and privacy. If any of these outcomes were to occur, our operational costs could increase significantly.
Failure to comply with state and federal antitrust requirements could adversely affect our business.
Through our merchant alliances, we hold an ownership interest in several competing merchant acquiring businesses while serving as an electronic processor for those businesses. In order to satisfy state and federal antitrust requirements, we actively maintain an antitrust compliance program. Notwithstanding our compliance program, it is possible that perceived or actual violations of state or federal antitrust requirements could give rise to regulatory enforcement investigations or actions. Regulatory scrutiny of, or regulatory enforcement action in connection with, compliance with state and federal antitrust requirements could have a material adverse effect on our reputation and business.
We may be sued for infringing the intellectual property rights of others.
Third parties may claim that we are infringing their intellectual property rights. We expose ourselves to additional liability when we agree to defend or indemnify our clients against third-party infringement claims. If the owner of intellectual property establishes that we are, or a client which we are obligated to indemnify is, infringing its intellectual property rights, we may be forced to change our products or services, and such changes may be expensive or impractical, or we may need to seek royalty or license agreements from the owner of such rights. If we are unable to agree on acceptable terms, we may be required to discontinue the sale of key products or halt other aspects of our operations. We may also be liable for financial damages for a violation of intellectual property rights, and we may incur expenses in connection with indemnifying our clients against losses suffered by them. Any adverse result related to violation of third-party intellectual property rights could materially and adversely harm our business, results of operations and financial condition. Even if intellectual property claims brought against us are without merit, they may result in costly and time-consuming litigation and may require significant attention from our management and key personnel.
Misappropriation of our intellectual property and proprietary rights could impair our competitive position.
Our ability to compete depends upon proprietary systems and technology. We actively seek to protect our intellectual property and proprietary rights. Nevertheless, unauthorized parties may attempt to copy aspects of our services or to obtain and use
information that we regard as proprietary. The steps we have taken may not prevent misappropriation of technology. Agreements entered into for that purpose may not be enforceable or provide us with an adequate remedy. It is also possible that others will independently develop the same or similar technology. Further, we use open source software in connection with our solutions. Companies that incorporate open source software into their solutions have, from time to time, faced claims challenging the ownership of solutions developed using open source software. As a result, we could be subject to suits by parties claiming ownership of what we believe to be open source software. Effective patent, trademark, service mark, copyright and trade secret protection may not be available in every country in which our applications and services are made available. The laws of certain non-U.S. countries where we do business or contemplate doing business in the future may not recognize intellectual property rights or protect them to the same extent as do the laws of the U.S. Misappropriation of our intellectual property or potential litigation concerning such matters could have a material adverse effect on our business, results of operations and financial condition.
Changes in tax laws and regulations could adversely affect our results of operations and cash flows from operations.
Our operations are subject to tax by federal, state, local, and international taxing jurisdictions. Changes in tax laws or their interpretations in our significant tax jurisdictions could materially increase the amount of taxes we owe, thereby negatively impacting our results of operations as well as our cash flows from operations. For example, the U.S. Tax Cuts and Jobs Act of 2017 (the “Tax Act”) significantly revised the U.S. corporate income tax code by, among other things, lowering corporate income tax rates, implementing a territorial-type tax system and imposing repatriation tax on deemed repatriated earnings of foreign subsidiaries. Further analysis of the Tax Act or future tax laws, regulations or guidance from the Internal Revenue Service, the Securities and Exchange Commission or the Financial Accounting Standards Board could cause us to adjust current estimates in future periods, which could impact our earnings and have an adverse effect on our results of operations and cash flow. Furthermore, our implementation of new practices and processes designed to comply with changing tax laws and regulations could require us to make substantial changes to our business practices, allocate additional resources, and increase our costs, which could negatively affect our business, results of operations and financial condition.
Unfavorable resolution of tax contingencies could adversely affect our results of operations and cash flows from operations.
Our tax returns and positions are subject to review and audit by federal, state, local and international taxing authorities. An unfavorable outcome to a tax audit could result in higher tax expense, thereby negatively impacting our results of operations as well as our cash flows from operations. We have established contingency reserves for known tax exposures relating to deductions, transactions and other matters involving some uncertainty as to the proper tax treatment of the item. These reserves reflect what we believe to be reasonable assumptions as to the likely final resolution of each issue if raised by a taxing authority. While we believe that the reserves are adequate to cover reasonably expected tax risks, there is no assurance that, in all instances, an issue raised by a tax authority will be finally resolved at a financial cost not in excess of any related reserve. An unfavorable resolution, therefore, could negatively impact our effective tax rate, financial position, results of operations, and cash flows in the current and/or future periods.
Organizational and Financial Risks
The failure to attract and retain key personnel could have a material adverse effect on our business.
We depend on the experience, skill and contributions of our senior management and other key employees. If we fail to attract, motivate and retain highly qualified management, technical, compliance and sales personnel, our future success could be harmed. Our senior management provides strategic direction for our company, and if we lose members of our leadership team, our management resources may have to be diverted from other priorities to address this loss. Our products and services require sophisticated knowledge of the financial services industry, applicable regulatory and industry requirements, computer systems, and software applications, and if we cannot hire or retain the necessary skilled personnel, we could suffer delays in new product development, experience difficulty complying with applicable requirements or otherwise fail to satisfy our clients’ demands.
Our merchants may be unable to satisfy obligations for which we may also be liable.
We are subject to the risk of our merchants being unable to satisfy obligations for which we may also be liable. For example, we and our merchant acquiring alliances may be subject to contingent liability for transactions originally acquired by us that are disputed by the cardholder and charged back to the merchants. If we or the alliance is unable to collect this amount from the merchant because of the merchant’s insolvency or other reasons, we or the alliance will bear the loss for the amount of the refund paid to the cardholder. Although we have an active program to manage our credit risk and often mitigate our risk by obtaining collateral, a default on such obligations by one or more of our merchants could have a material adverse effect on our business and results of operations.
Fraud by merchants or others could have a material adverse effect on our business, results of operations and financial condition.
We may be subject to potential liability for fraudulent transactions, including electronic payment and card transactions or credits initiated by merchants or others. Examples of merchant fraud include when a merchant or other party knowingly uses a stolen or counterfeit credit, debit or prepaid card, card number or other credentials to record a false sales transaction, processes an invalid card or intentionally fails to deliver the merchandise or services sold in an otherwise valid transaction. Criminals are using increasingly sophisticated methods to engage in illegal activities such as counterfeiting and fraud. We also rely on ISOs to sell our merchant processing services, which they may do by contracting with their own sub-ISOs. We rely on these ISOs and sub-ISOs to exercise appropriate controls to avoid fraudulent transactions. It is possible that incidents of fraud could increase in the future. Failure to effectively manage risk and prevent fraud, or otherwise effectively administer our chargeback responsibilities, would increase our chargeback liability or expose us to fines or other liabilities. Increases in chargebacks, fines or other liabilities could have a material adverse effect on our business, results of operations and financial condition.
Acquisitions subject us to risks, including assumption of unforeseen liabilities and difficulties in integrating operations.
A major contributor to our growth in revenue and earnings since our inception has been our ability to identify, acquire and integrate complementary businesses. We anticipate that we will continue to seek to acquire complementary businesses, products and services. We may not be able to identify suitable acquisition candidates or complete acquisitions in the future, which could adversely affect our future growth; or businesses that we acquire may not perform as well as expected or may be more difficult or expensive to integrate and manage than expected, which could adversely affect our business and results of operations. We may not be able to integrate all aspects of acquired businesses successfully or realize the potential benefits of bringing them together. In addition, the process of integrating these acquisitions may disrupt our business and divert our resources.
In addition, acquisitions outside of the U.S. often involve additional or increased risks including, for example:
•managing geographically separated organizations, systems and facilities;
•integrating personnel with diverse business backgrounds and organizational cultures;
•complying with non-U.S. regulatory requirements;
•fluctuations in currency exchange rates;
•enforcement of intellectual property rights in some non-U.S. countries;
•difficulty entering new non-U.S. markets due to, among other things, consumer acceptance and business knowledge of these new markets; and
•general economic and political conditions.
These risks may arise for a number of reasons: we may not be able to find suitable businesses to acquire at affordable valuations or on other acceptable terms; we may face competition for acquisitions from other potential acquirers; we may need to borrow money or sell equity or debt securities to the public to finance acquisitions and the terms of these financings may be adverse to us; changes in accounting, tax, securities or other regulations could increase the difficulty or cost for us to complete acquisitions; we may incur unforeseen obligations or liabilities in connection with acquisitions; we may need to devote unanticipated financial and management resources to an acquired business; we may not realize expected operating efficiencies or product integration benefits from an acquisition; we could enter markets where we have minimal prior experience; and we may experience decreases in earnings as a result of non-cash impairment charges.
We may be obligated to indemnify the purchasers of businesses pursuant to the terms of the relevant purchase and sale agreements.
We have in the past and may in the future sell businesses. In connection with sales of businesses, we may make representations and warranties about the businesses and their financial affairs and agree to retain certain liabilities associated with our operation of the businesses prior to their sale. Our obligation to indemnify the purchasers and agreement to retain liabilities could have a material adverse effect on our business, results of operations and financial condition.
Our balance sheet includes significant amounts of goodwill and intangible assets. The impairment of a significant portion of these assets would negatively affect our results of operations.
Our balance sheet includes goodwill and intangible assets that represent 69% of our total assets at December 31, 2020. These assets consist primarily of goodwill and identified intangible assets associated with our acquisitions. On at least an annual basis, we assess whether there have been impairments in the carrying value of goodwill. In addition, we review intangible assets for impairment whenever events or changes in circumstances indicate the carrying amount of the asset may not be recoverable. If the carrying value of the asset is determined to be impaired, then it is written down to fair value by a charge to operating earnings. An impairment of a significant portion of goodwill or intangible assets could have a material negative effect on our results of operations.
Existing or future leverage may harm our financial condition and results of operations.
At December 31, 2020, we had approximately $20.7 billion of debt. We and our subsidiaries may incur additional indebtedness in the future. Our indebtedness could: decrease our ability to obtain additional financing for working capital, capital expenditures, general corporate or other purposes; limit our flexibility to make acquisitions; increase our cash requirements to support the payment of interest; limit our flexibility in planning for, or reacting to, changes in our business and our industry; and increase our vulnerability to adverse changes in general economic and industry conditions. Our ability to make payments of principal and interest on our indebtedness depends upon our future performance, which will be subject to general economic conditions and financial, business and other factors affecting our consolidated operations, many of which are beyond our control. In addition, if certain of our outstanding senior notes are downgraded to below investment grade, we may incur additional interest expense. If we are unable to generate sufficient cash flow from operations in the future to service our debt and meet our other cash requirements, we may be required, among other things: to seek additional financing in the debt or equity markets; to refinance or restructure all or a portion of our indebtedness; or to reduce or delay planned capital or operating expenditures. Such measures might not be sufficient to enable us to service our debt and meet our other cash requirements. In addition, any such financing, refinancing or sale of assets might not be available at all or on economically favorable terms.
An increase in interest rates may negatively impact our operating results and financial condition.
Certain of our borrowings, including borrowings under our revolving credit facility, term loan, foreign lines of credit and receivable securitization facility, are at variable rates of interest. An increase in interest rates would have a negative impact on our results of operations by causing an increase in interest expense. At December 31, 2020, we had approximately $1.8 billion in variable rate debt, which includes $1.3 billion on our term loan, $166 million drawn on our revolving credit facility and lines of credit and $425 million drawn on our accounts receivable securitization facility. Based on outstanding debt balances and interest rates at December 31, 2020, a 1% increase in variable interest rates would result in a decrease to annual pre-tax income of $18 million.
Our results of operations may be adversely affected by changes in foreign currency exchange rates.
We are subject to risks related to changes in currency rates as a result of our investments in foreign operations and from revenues generated in currencies other than the U.S. dollar. Revenues and profit generated by such international operations will increase or decrease compared to prior periods as a result of changes in foreign currency exchange rates. From time to time, we utilize foreign currency forward contracts and other hedging instruments to mitigate the market value risks associated with foreign currency-denominated transactions and investments. These hedging strategies may not, however, eliminate all of the risks related to foreign currency translation, and we may forgo the benefits we would otherwise experience if currency exchange rates were to change in our favor. We have also issued foreign currency-denominated senior notes for which payments of interest and principal are to be made in foreign currency, and fluctuations in foreign currency exchange rates could cause the expense associated with such payments to increase. In addition, we may become subject to exchange control regulations that restrict or prohibit the conversion of our foreign revenue currencies into U.S. dollars. Any of these factors could decrease the value of revenues and earnings we derive from our international operations and have a material adverse effect on our business.
First Data Acquisition Risks
The synergies attributable to the acquisition may vary from expectations.
We may fail to realize the anticipated benefits and synergies expected from the acquisition, which could adversely affect our business, results of operations and financial condition. The success of the acquisition will depend, in significant part, on our ability to successfully integrate the acquired business, grow the revenue of the combined company and realize the anticipated strategic benefits and synergies from the combination. This growth and the anticipated benefits of the transaction may not be realized fully or may take longer to realize than expected. Actual operating, technological, strategic, synergy and revenue
opportunities may be less significant than expected or may take longer to achieve than anticipated. If we are not able to achieve these objectives and realize the anticipated benefits and synergies expected from the acquisition within the anticipated timing, our business, results of operations and financial condition may be adversely affected.
We have incurred and expect to continue to incur substantial expenses related to the integration.
We have incurred and expect to continue to incur substantial expenses in connection with the integration of First Data. There are a large number of processes, policies, procedures, operations, technologies and systems that may need to be integrated, including our business operating platforms, purchasing, accounting and finance, sales, payroll, pricing and benefits. While we have assumed that a certain level of expenses will be incurred, there are many factors beyond our control that could affect the total amount or the timing of the integration expenses. Moreover, many of the expenses that we will continue to incur are, by their nature, difficult to estimate accurately. These expenses could, particularly in the near term, exceed the savings that we expect to achieve from the elimination of duplicative expenses and the realization of economies of scale and cost savings. These integration expenses may result in us taking significant charges against earnings, and the amount and timing of such charges are uncertain at present.
Our future results will be negatively impacted if we do not effectively manage our expanded operations.
As a result of the acquisition, the size of our business has increased significantly. Our future success will depend, in part, upon our ability to manage this expanded business, which will pose substantial challenges for management, including challenges related to the management and monitoring of new operations; integrating complex systems, technology, networks and other assets in a seamless manner that minimizes any adverse impact on customers, suppliers, employees and other constituencies; potential unknown liabilities; and associated increased costs. We may also face increased scrutiny from governmental authorities as a result of the significant increase in the size of our business. Any of these issues could adversely affect our ability to maintain relationships with customers, suppliers, employees and other constituencies or achieve the anticipated benefits of the acquisition or could reduce our earnings or otherwise adversely affect our business and financial results.
New Omaha Holdings L.P. may sell a substantial amount of our common stock as certain restrictions on sales expire, and these sales could cause the price of our common stock to fall.
New Omaha Holdings L.P. (“New Omaha”) owns approximately 13% of our outstanding shares. New Omaha may sell its shares subject to certain limitations contained in the shareholder agreement between us and New Omaha. Under a registration rights agreement entered into in connection with the acquisition, we have granted New Omaha registration rights, which permit, among others, underwritten offerings. The registration rights agreement will terminate when the aggregate ownership percentage of the issued and outstanding shares of our common stock held by New Omaha and its affiliate transferees falls below 2% and such shares may be freely sold without restrictions.
New Omaha may have influence over us and its interests may conflict with other shareholders.
New Omaha owns approximately 13% of our issued and outstanding shares and is our largest shareholder. Under the shareholder agreement between us and New Omaha, New Omaha may designate a director to serve on our board of directors in accordance with the terms thereof until the aggregate ownership percentage of our issued and outstanding shares of common stock held by New Omaha and its affiliate transferees first falls below 5%. The shareholder agreement will terminate when the aggregate ownership percentage of our outstanding shares held by New Omaha and certain of its affiliates falls below 3%. Although there are various restrictions on New Omaha’s ability to take certain actions with respect to us and our shareholders (including certain standstill provisions for so long as New Omaha’s aggregate ownership percentage of the issued and outstanding shares of our common stock remains at or above 5%), New Omaha may seek to influence, and may be able to influence, us through its appointment of a director to our board of directors and its share ownership.
Item 1B. Unresolved Staff Comments
None.
Item 2. Properties
At December 31, 2020, we owned 20 properties and leased 161 properties globally. These locations are used for operational, sales, management and administrative purposes. As a normal part of our business operations, including in connection with the integration of companies that we acquire, we regularly review our real estate portfolio. We may choose to acquire or dispose of properties in order to maintain a real estate footprint designed to maximize collaboration, innovation and communication in ways that enable us to best serve our clients and to create more opportunities for professional growth and development for our associates.
Item 3. Legal Proceedings
In the normal course of business, we or our subsidiaries are named as defendants in lawsuits in which claims are asserted against us. In the opinion of management, the liabilities, if any, which may ultimately result from such lawsuits are not expected to have a material adverse effect on our consolidated financial statements.
Item 4. Mine Safety Disclosures
Not applicable.
INFORMATION ABOUT OUR EXECUTIVE OFFICERS
The names of our executive officers as of February 26, 2021, together with their ages, positions and business experience are described below:
| | | | | | | | |
| Name | Age | Title |
| Frank J. Bisignano | 61 | President and Chief Executive Officer |
| | |
| Guy Chiarello | 61 | Chief Administrative Officer |
| Christopher M. Foskett | 63 | Executive Vice President, Global Sales |
| Robert W. Hau | 55 | Chief Financial Officer |
| Lynn S. McCreary | 61 | Chief Legal Officer and Secretary |
| Devin B. McGranahan | 51 | Executive Vice President, Senior Group President |
| Byron C. Vielehr | 57 | Chief Digital and Data Officer |
Mr. Bisignano has served as Chief Executive Officer since July 2020 and a director and President since July 2019. He served as Chief Operating Officer from July 2019 until July 2020. Mr. Bisignano joined Fiserv as part of the acquisition of First Data Corporation, where he served as chief executive officer since 2013 and chairman since 2014. From 2005 to 2013, he held various executive positions with JPMorgan Chase & Co., a global financial services firm, including co-chief operating officer, chief executive officer of mortgage banking and chief administrative officer. From 2002 to 2005, Mr. Bisignano served as chief executive officer for Citigroup’s Global Transactions Services business and a member of Citigroup’s Management Committee.
Mr. Chiarello has served as Chief Administrative Officer since July 2019. Mr. Chiarello joined Fiserv as part of the acquisition of First Data Corporation, where he served as president since 2013. From 2008 to 2013, he served as chief information officer of JPMorgan Chase & Co., a global financial services firm. From 1985 to 2008, Mr. Chiarello served in various technology and leadership roles including chief information officer at Morgan Stanley, a global financial services firm.
Mr. Foskett has served as Executive Vice President, Global Sales since July 2019. Mr. Foskett joined Fiserv as part of the acquisition of First Data Corporation, where he served as executive vice president, head of corporate and business development since 2015 and co-head of global financial services since 2018. He joined First Data Corporation in 2014 as head of global, strategic and national accounts. From 2011 to 2014, Mr. Foskett served as managing director, head of North American treasury services and global head of sales for treasury services at JPMorgan Chase & Co., a global financial services firm. From 2009 to 2011, he was managing director, global head of financial institutions at National Australia Bank, an Australian financial institution. From 1991 to 2008, Mr. Foskett was managing director in Citigroup’s Corporate & Investment Bank leading several global businesses. Prior to that, he was employed by Goldman Sachs & Co. and Merrill Lynch & Co. focusing on mergers and acquisitions.
Mr. Hau has served as Chief Financial Officer since 2016. Before joining Fiserv, Mr. Hau served as executive vice president and chief financial officer at TE Connectivity Ltd., a global technology and manufacturing company, from 2012 to 2016. From 2009 to 2012, he served as executive vice president and chief financial officer at Lennox International Inc., a provider of products and services in the heating, air conditioning, and refrigeration markets; and from 2006 to 2009, he served as vice president and chief financial officer for the aerospace business group of Honeywell International, Inc., a technology and manufacturing company. Mr. Hau joined Honeywell (initially AlliedSignal) in 1987 and served in a variety of senior financial leadership positions, including vice president and chief financial officer for the company’s aerospace electronic systems unit and for its specialty materials business group.
Ms. McCreary has served as Chief Legal Officer and Secretary since 2013. Ms. McCreary joined Fiserv in 2010 as senior vice president and deputy general counsel. Prior to joining Fiserv, Ms. McCreary was a partner with the law firm of Bryan Cave LLP from 1996 to 2010, including serving as managing partner of its San Francisco, California office from its opening in 2008 to 2010. Ms. McCreary began her career in financial services with positions at Citicorp Person-to-Person and Metropolitan Life Insurance Company’s mortgage subsidiary, Metmor Financial, Inc.
Mr. McGranahan has served as Executive Vice President, Senior Group President since 2018 and joined Fiserv in 2016 as group president, Billing and Payments Group. Before joining Fiserv, Mr. McGranahan served as a senior partner at McKinsey & Company, a global management consulting firm. While there, he held a variety of senior management roles, including leader of the global insurance practice from 2013 to 2016 and co-chair of the global senior partner election committee from 2013 to 2015. In addition, Mr. McGranahan served as co-leader of the North America financial services practice from 2009 to 2016. He joined McKinsey & Company in 1992 and served in a variety of other leadership positions prior to 2009, including leader of the North American property and casualty practice and managing partner of the Pittsburgh office.
Mr. Vielehr has served as Chief Digital and Data Officer since January 2021. He previously served as Executive Vice President, Senior Group President from 2019 to January 2021, Chief Administrative Officer from 2018 to 2019, and as Group President, Depository Institution Services Group from 2013 to 2018. Prior to joining Fiserv, from 2005 to 2013, Mr. Vielehr served in a succession of senior executive positions with The Dun & Bradstreet Corporation, a provider of commercial information and business insight solutions, most recently as president of international and global operations. He also previously served as president and chief operating officer of Northstar Systems International, Inc., a developer of wealth management software (now part of SEI Investments Company), from 2004 to 2005. Mr. Vielehr has more than 25 years of experience in the financial services and technology industries, including a variety of executive leadership roles at Merrill Lynch & Co. and Strong Capital Management.
PART II
Item 5. Market for Registrant’s Common Equity, Related Stockholder Matters and Issuer Purchases of Equity Securities
Market Price Information
Our common stock is traded on the NASDAQ Global Select Market under the symbol “FISV.” At December 31, 2020, our common stock was held by 1,690 shareholders of record and by a significantly greater number of shareholders who hold shares in nominee or street name accounts with brokers. We have never paid dividends on our common stock and we do not anticipate paying dividends in the foreseeable future. For additional information regarding our expected use of capital, refer to the discussion in this report under the heading “Management’s Discussion and Analysis of Financial Condition and Results of Operations – Liquidity and Capital Resources.”
Issuer Purchases of Equity Securities
The table below sets forth information with respect to purchases made by or on behalf of us or any “affiliated purchaser” (as defined in Rule 10b-18(a)(3) under the Securities Exchange Act of 1934) of shares of our common stock during the three months ended December 31, 2020: | | | | | | | | | | | | | | | | | | | | | | | | | | |
| | | | | | | | |
| Period | | Total Number of
Shares Purchased | | Average Price
Paid per Share | | Total Number of Shares Purchased as Part of Publicly Announced Plans or Programs (1) | | Maximum Number of Shares that May Yet Be Purchased Under the Plans or Programs (1) |
| October 1-31, 2020 | | — | | | $ | — | | | — | | | 7,486,000 | |
| November 1-30, 2020 | | — | | | — | | | — | | | 67,486,000 | |
| December 1-31, 2020 | | 1,818,000 | | | 110.04 | | | 1,818,000 | | | 65,668,000 | |
| Total | | 1,818,000 | | | | | 1,818,000 | | | |
| | | | | | | | |
(1)On August 8, 2018 and November 19, 2020, our board of directors authorized the purchase of up to 30.0 million and 60.0 million shares of our common stock, respectively. These authorizations do not expire.
In connection with the vesting of restricted stock awards, shares of common stock are delivered to the Company by employees to satisfy tax withholding obligations. The following table summarizes such purchases of common stock during the three months ended December 31, 2020: | | | | | | | | | | | | | | | | | | | | | | | | | | |
| | | | | | | | |
| Period | | Total Number of
Shares Purchased | | Average Price
Paid per Share | | Total Number of
Shares Purchased
as Part of Publicly
Announced Plans
or Programs | | Maximum Number
of Shares that May
Yet Be Purchased
Under the Plans or
Programs |
| October 1-31, 2020 | | — | | | $ | — | | | — | | | — | |
| November 1-30, 2020 | | — | | | — | | | — | | | — | |
| December 1-31, 2020 | | 30,900 | | (1) | 113.86 | | | — | | | — | |
| Total | | 30,900 | | | | | — | | | |
| | | | | | | | |
(1)Shares surrendered to us to satisfy tax withholding obligations in connection with the vesting of restricted stock awards issued to employees.
Stock Performance Graph
The stock performance graph and related information presented below is not deemed to be “soliciting material” or to be “filed” with the Securities and Exchange Commission or subject to Regulation 14A or 14C under the Securities Exchange Act of 1934 or to the liabilities of Section 18 of the Securities Exchange Act of 1934 and will not be deemed to be incorporated by reference into any filing under the Securities Act of 1933 or the Securities Exchange Act of 1934, except to the extent we specifically incorporate it by reference into such a filing.
The following graph compares the cumulative total shareholder return on our common stock for the five years ended December 31, 2020 with the S&P 500 Index and the NASDAQ US Benchmark Transaction Processing Services Index (the “Index”). Prior to September 21, 2020, the Index was known as the NASDAQ US Benchmark Financial Administration Index. The Index, as renamed, is identical to the NASDAQ US Benchmark Financial Administration Index prior to its name change on September 21, 2020. The graph assumes that $100 was invested on December 31, 2015 in our common stock and each index and that all dividends were reinvested. No cash dividends have been declared on our common stock. The comparisons in the graph are required by the Securities and Exchange Commission and are not intended to forecast or be indicative of possible future performance of our common stock.
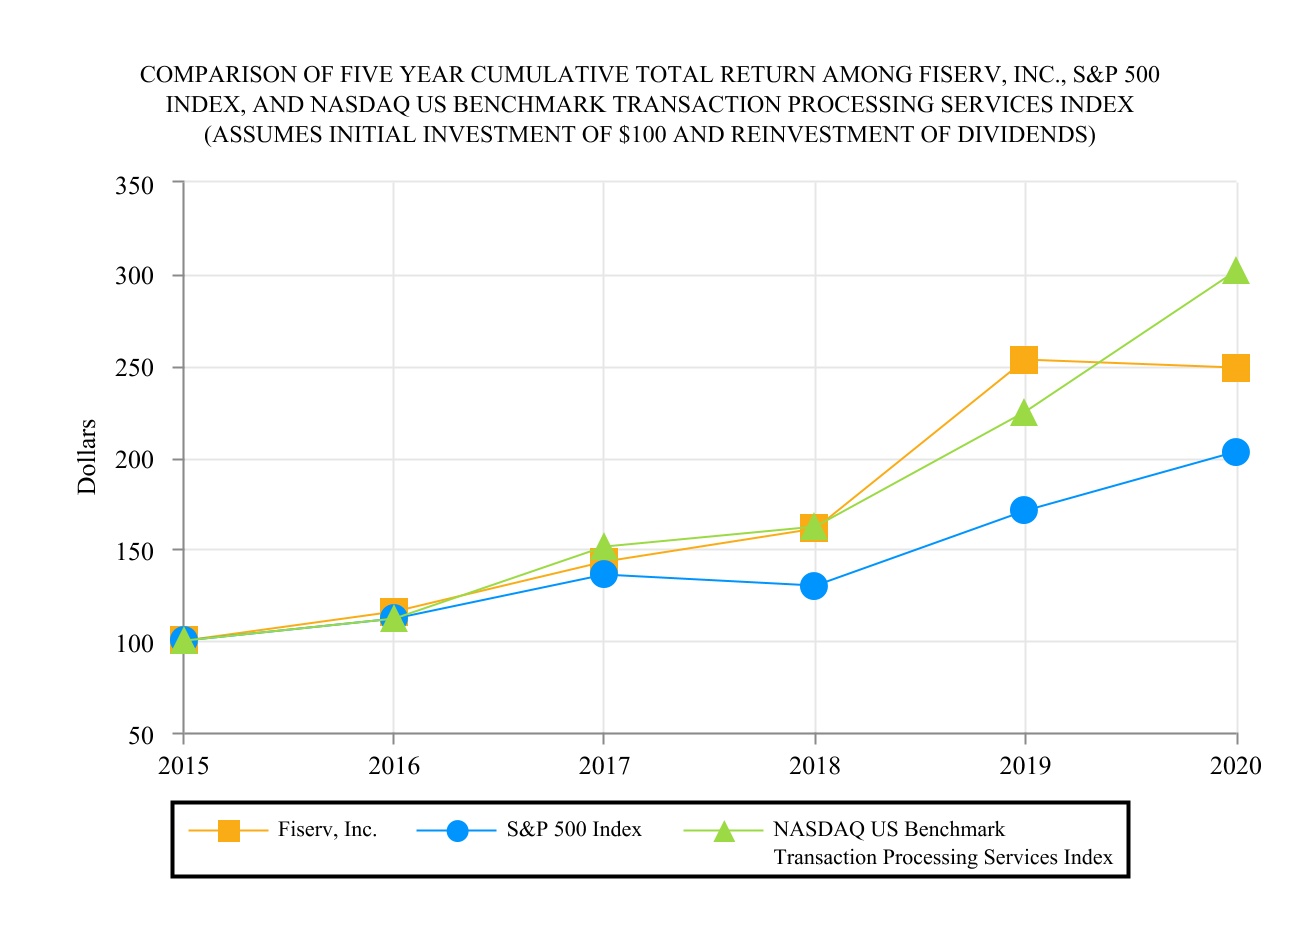
| | | | | | | | | | | | | | | | | | | | | | | | | | | | | | | | | | | |
| | December 31, |
| | 2015 | | 2016 | | 2017 | | 2018 | | 2019 | | 2020 |
| Fiserv, Inc. | $ | 100 | | | $ | 116 | | | $ | 143 | | | $ | 161 | | | $ | 253 | | | $ | 249 | |
| S&P 500 Index | 100 | | | 112 | | | 136 | | | 130 | | | 171 | | | 203 | |
| NASDAQ US Benchmark Transaction Processing Services Index | 100 | | | 112 | | | 151 | | | 162 | | | 225 | | | 302 | |
Item 6. Selected Financial Data
The following data should be read in conjunction with the consolidated financial statements and accompanying notes and the sections entitled “Management’s Discussion and Analysis of Financial Condition and Results of Operations” contained in this Annual Report on Form 10-K. The selected historical data presented below has been affected by the First Data and other acquisitions, dispositions and transactional gains recorded by our unconsolidated affiliates, debt financing activities, foreign currency fluctuations, the tax effects related to share-based payment awards and by the Tax Cuts and Jobs Act enacted in December 2017. In addition, effective January 1, 2020, we adopted Accounting Standards Update (“ASU”) No. 2016-13, Financial Instruments - Credit Losses (Topic 326), using the required modified retrospective approach, which resulted in a cumulative-effect decrease to beginning retained earnings of $45 million. Effective January 1, 2019, we adopted ASU No. 2016-02, Leases (Topic 842), and its related amendments using the optional transition method applied to all leases. The adoption of the new lease standard resulted in the recognition of lease liabilities and right-of-use assets on the consolidated balance sheet beginning January 1, 2019. Under the optional transition approach, prior period amounts have not been restated. Effective January 1, 2018, we adopted ASU No. 2014-09, Revenue from Contracts with Customers, and its related amendments using the modified retrospective transition approach applied to all contracts. Under this transition approach, prior period amounts have not been restated. All per share amounts are presented on a split-adjusted basis to retroactively reflect the two-for-one stock split that was completed in the first quarter of 2018. | | | | | | | | | | | | | | | | | | | | | | | | | | | | | |
| | | | | | | | | |
| (In millions, except per share data) | 2020 | | 2019 | | 2018 | | 2017 | | 2016 |
| Total revenue | $ | 14,852 | | | $ | 10,187 | | | $ | 5,823 | | | $ | 5,696 | | | $ | 5,505 | |
| Income from continuing operations | $ | 975 | | | $ | 914 | | | $ | 1,187 | | | $ | 1,232 | | | $ | 930 | |
| Income from discontinued operations, net of income taxes | — | | | — | | | — | | | 14 | | | — | |
| Net income | 975 | | | 914 | | | 1,187 | | | 1,246 | | | 930 | |
| Less: net income attributable to noncontrolling interests and redeemable noncontrolling interests | 17 | | | 21 | | | — | | | — | | | — | |
| Net income attributable to Fiserv, Inc. | $ | 958 | | | $ | 893 | | | $ | 1,187 | | | $ | 1,246 | | | $ | 930 | |
| | | | | | | | | |
| Net income attributable to Fiserv, Inc. per share – basic: | | | | | | | | | |
| Continuing operations | $ | 1.42 | | | $ | 1.74 | | | $ | 2.93 | | | $ | 2.92 | | | $ | 2.11 | |
| Discontinued operations | — | | | — | | | — | | | 0.03 | | | — | |
| Total | $ | 1.42 | | | $ | 1.74 | | | $ | 2.93 | | | $ | 2.95 | | | $ | 2.11 | |
| | | | | | | | | |
| Net income attributable to Fiserv, Inc. per share – diluted: | | | | | | | | | |
| Continuing operations | $ | 1.40 | | | $ | 1.71 | | | $ | 2.87 | | | $ | 2.86 | | | $ | 2.08 | |
| Discontinued operations | — | | | — | | | — | | | 0.03 | | | — | |
| Total | $ | 1.40 | | | $ | 1.71 | | | $ | 2.87 | | | $ | 2.89 | | | $ | 2.08 | |
| | | | | | | | | |
| Total assets | $ | 74,619 | | | $ | 77,539 | | | $ | 11,262 | | | $ | 10,289 | | | $ | 9,743 | |
| Long-term debt (including short-term and current maturities) | 20,684 | | | 21,899 | | | 5,959 | | | 4,900 | | | 4,562 | |
| Fiserv, Inc. shareholders’ equity | 32,330 | | | 32,979 | | | 2,293 | | | 2,731 | | | 2,541 | |
| | | | | | | | | |
Item 7. Management’s Discussion and Analysis of Financial Condition and Results of Operations
Management’s discussion and analysis of financial condition and results of operations is provided as a supplement to our consolidated financial statements and accompanying notes to help provide an understanding of our financial condition, the changes in our financial condition and our results of operations. Our discussion is organized as follows:
•Overview. This section contains background information on our company and the services and products that we provide, acquisitions and dispositions, our enterprise priorities, and the trends affecting our industry in order to provide context for management’s discussion and analysis of our financial condition and results of operations.
•Critical accounting policies and estimates. This section contains a discussion of the accounting policies that we believe are important to our financial condition and results of operations and that require judgment and estimates on the part of management in their application. In addition, all of our significant accounting policies, including critical accounting policies, are summarized in Note 1 to the accompanying consolidated financial statements.
•Results of operations. This section contains an analysis of our results of operations presented in the accompanying consolidated statements of income by comparing the results for the year ended December 31, 2020 to the results for the year ended December 31, 2019 and by comparing the results for the year ended December 31, 2019 to the results for the year ended December 31, 2018.
•Liquidity and capital resources. This section provides an analysis of our cash flows and a discussion of our outstanding debt and commitments at December 31, 2020.
Overview
Company Background
We are a leading global provider of payments and financial services technology solutions. We provide account processing and digital banking solutions; card issuer processing and network services; payments; e-commerce; merchant acquiring and processing; and the Clover® cloud-based point-of-sale (“POS”) solution. We serve clients around the globe, including banks, credit unions, other financial institutions, corporate clients and merchants.
On July 29, 2019, we acquired First Data Corporation (“First Data”), a global leader in commerce-enabling technology and solutions for merchants, financial institutions and card issuers. Effective in the first quarter of 2020, we realigned our reportable segments to reflect our new management structure and organizational responsibilities (“Segment Realignment”) following the acquisition of First Data.
Our operations are comprised of the Merchant Acceptance (“Acceptance”) segment, the Financial Technology (“Fintech”) segment and the Payments and Network (“Payments”) segment. The consolidated financial statements include the financial results of First Data from the date of acquisition. Segment results for the years ended December 31, 2019 and 2018 have been restated to reflect the Segment Realignment.
The Acceptance segment provides a wide range of commerce-enabling solutions to merchants of all sizes and types around the world. These solutions include POS merchant acquiring and digital commerce services; mobile payment services; security and fraud protection products and services; CaratSM, our omnichannel commerce solution; and our cloud-based Clover POS platform, which includes a marketplace for proprietary and third-party business applications. The businesses in the Acceptance segment are subject to a modest level of seasonality, with the first quarter generally experiencing the lowest level of revenue and the fourth quarter experiencing the highest level of revenue.
The Fintech segment provides financial institutions around the world with technology solutions that enable them to process customer deposit and loan accounts and manage general ledger and central information files, as well as other products and services that support numerous types of financial transactions such as digital banking, financial and risk management, cash management, professional services and consulting, and item processing and source capture services. Our businesses in this segment also provide products and services to corporate clients to facilitate the management of financial processes and transactions.
The Payments segment primarily provides financial institutions and corporate clients with the products and services required to process digital payment transactions, including card transactions such as debit, credit and prepaid card processing and services, a range of network services, security and fraud protection products, card production and print services. In addition, our businesses in this segment offer non-card digital payment software and services, including bill payment, account-to-account transfers, person-to-person payments, electronic billing, and security and fraud protection products.
The majority of our revenue is generated from recurring account- and transaction-based fees under multi-year contracts with high renewal rates. Most of the services we provide within our segments are necessary for our clients to operate their businesses and are, therefore, non-discretionary in nature.
Corporate and Other supports the reportable segments described above, and consists of amortization of acquisition-related intangible assets, unallocated corporate expenses and other activities that are not considered when we evaluate segment performance, such as gains or losses on sales of businesses, costs associated with acquisition and divestiture activity, and our Output Solutions postage reimbursements. Corporate and Other also includes the historical results of our Investment Services business, of which we sold a 60% controlling interest in February 2020, as well as certain transition services revenue associated with various dispositions.
Acquisitions and Dispositions
We frequently review our portfolio to ensure we have the right set of businesses to execute on our strategy. We expect to acquire businesses when we identify: a compelling strategic need, such as a product, service or technology that helps meet client demand; an opportunity to change industry dynamics; a way to achieve business scale; or similar considerations. We expect to divest businesses that are not in line with our market, product or financial strategies.
Acquisitions
On March 2, 2020, we acquired MerchantPro Express LLC (“MerchantPro”), an independent sales organization (“ISO”) that provides processing services, POS equipment and merchant cash advances to businesses across the United States. MerchantPro is included within the Acceptance segment and further expands our merchant services business. On March 18, 2020, we acquired Bypass Mobile, LLC (“Bypass”), an independent software vendor and innovator in enterprise POS systems for sports and entertainment venues, food service management providers and national restaurant chains. Bypass is included within the Acceptance segment and further enhances our omni-commerce capabilities, enabling enterprise businesses to deliver a seamless customer experience that spans physical and digital channels. On May 11, 2020, we acquired Inlet, LLC (“Inlet”), a provider of secure digital delivery solutions for enterprise and middle-market billers’ invoices and statements. Inlet is included within the Payments segment and further enhances our digital bill payment strategy. We acquired these businesses for an aggregate purchase price of $167 million, net of $2 million of acquired cash, and including earn-out provisions estimated at a fair value of $45 million.
On July 29, 2019, we acquired First Data for a total purchase price of $46.5 billion by acquiring 100% of the First Data stock that was issued and outstanding as of the date of acquisition. As a result of the acquisition, First Data stockholders received 286 million shares of common stock of Fiserv, Inc., at an exchange ratio of 0.303 shares of Fiserv, Inc. for each share of First Data common stock, with cash paid in lieu of fractional shares. We also converted 15 million outstanding First Data equity awards into corresponding equity awards relating to common stock of Fiserv, Inc. in accordance with the exchange ratio. In addition, concurrent with the closing of the acquisition, we made a cash payment of $16.4 billion to repay existing First Data debt. We funded the transaction-related expenses and the repayment of First Data debt through a combination of available cash on-hand, proceeds from the issuance of senior notes, and term loan and revolving credit facility borrowings. The acquisition of First Data, included within the Acceptance and Payments segments, increases our footprint as a global payments and financial technology provider by expanding the portfolio of services provided to financial institutions, corporate and merchant clients and consumers.
On October 31, 2018, we acquired the debit card processing, ATM Managed Services, and MoneyPass® surcharge-free network of Elan Financial Services, a unit of U.S. Bancorp, for approximately $659 million including post-closing working capital adjustments, estimated contingent consideration related to earn-out provisions and future payments under a transition services agreement in excess of estimated fair value. This acquisition, included within the Payments segment, deepens our presence in debit card processing, broadens our client reach and scale and provides new solutions to enhance the value proposition for our existing debit solution clients.
On January 22, 2021, we acquired Ondot Systems, Inc., a digital experience platform provider for financial institutions. This acquisition, to be included within the Payments segment, will further expand our digital capabilities, enhancing our suite of integrated solutions spanning card-based payments, digital banking platforms, core banking, and merchant solutions to enable clients of all sizes to deliver frictionless, digital-first and personalized experiences to their customers.
Dispositions
Effective July 1, 2020, we and Bank of America (“BANA”) dissolved the Banc of America Merchant Services joint venture (“BAMS” or the “joint venture”), of which we maintained a 51% controlling ownership interest. Upon dissolution of the joint venture’s operations, the joint venture transferred a proportionate share of value, primarily the client contracts, to each party via
an agreed upon contractual separation. The remaining activities of the joint venture will consist of supporting the transition of the business to each party and an orderly wind down of remaining BAMS assets and liabilities. The revenues and expenses of the BAMS joint venture were consolidated into our financial results though the date of dissolution. The business transferred to us will continue to be operated and managed within our Acceptance segment.
We will continue to provide merchant processing and related services to former BAMS clients allocated to BANA, at BAMS pricing, through June 2023. We will also provide processing and other support services to new BANA merchant clients pursuant to a five-year non-exclusive agreement which, after June 2023, will also apply to the former BAMS clients allocated to BANA. In addition, both companies are entitled to certain transition services, at fair value, from each other through June 2023.
On February 18, 2020, we sold a 60% controlling interest of our Investment Services business, subsequently renamed as Tegra118, LLC (“Tegra118”), which is reported within Corporate and Other following the Segment Realignment. We received pre-tax proceeds of $578 million, net of related expenses, resulting in a pre-tax gain on the sale of $428 million, with a related tax expense of $112 million. Our retained interest is accounted for as an equity method investment. On February 2, 2021, Tegra118 completed a merger with a third party, resulting in a dilution of our ownership interest in the combined new entity, Wealthtech Holdings, LLC.
In connection with the acquisition of First Data, we acquired two businesses which we intended to sell. In October 2019, we completed the sales, at acquired fair value, of these two businesses for aggregate proceeds of $133 million.
On March 29, 2018, we sold a 55% controlling interest of our Lending Solutions business, which was reported within the Fintech segment, retaining 45% ownership interests in two joint ventures (the “Lending Joint Ventures”). In conjunction with this transaction, we entered into transition services agreements to provide, at fair value, various administration, business process outsourcing and data center related services for defined periods to the Lending Joint Ventures. We received gross sale proceeds of $419 million from the transactions. In August 2019, the Sagent Auto, LLC joint venture, formerly known as Fiserv Automotive Solutions, LLC, completed a merger with a third party, resulting in the dilution of our ownership interest to 31% in the combined entity, defi SOLUTIONS Group, LLC. Our remaining ownership interest in the Lending Joint Ventures are accounted for as equity method investments. In addition, in January 2018, we completed the sale of the retail voucher business acquired in our 2017 acquisition of Monitise for proceeds of £37 million ($50 million).
Enterprise Priorities
We aspire to move money and information in a way that moves the world by delivering superior value for our clients through leading technology, targeted innovation and excellence in everything we do. We achieve this through active portfolio management of our business, enhancing the overall value of our existing client relationships, improving operational effectiveness, being disciplined in our allocation of capital, and differentiating our products and services through innovation. Our long-term priorities are to (i) deliver integration value from the First Data acquisition; (ii) continue to build high-quality revenue while meeting our earnings goals; (iii) enhance client relationships with an emphasis on digital and payment solutions; and (iv) deliver innovation and integration which enables differentiated value for our clients.
Industry Trends
The global payments landscape continues to evolve, with rapidly advancing technologies and a steady expansion of digital payments, e-commerce and innovation in real-time payments infrastructure. Because of this growth, competition also continues to evolve. Business and consumer expectations continue to rise, with a focus on convenience and security. To meet these expectations, payments companies are focused on modernizing their technology, expanding the use of data and enhancing the customer experience.
Financial Institutions
The market for products and services offered by financial institutions continues to evolve rapidly. The traditional financial industry and other market entrants regularly introduce and implement new payment, deposit, risk management, lending and investment products, and the distinctions among the products and services traditionally offered by different types of financial institutions continue to narrow as they seek to serve the same customers. At the same time, the evolving global regulatory and cybersecurity landscape has continued to create a challenging operating environment for financial institutions. These conditions are driving heightened interest in solutions that help financial institutions win and retain customers, generate incremental revenue, comply with regulations and enhance operating efficiency. Examples of these solutions include electronic payments and delivery methods such as internet, mobile and tablet banking, sometimes referred to as “digital channels.”
The focus on digital channels by both financial institutions and their customers, as well as the growing volume and types of payment transactions in the marketplace, continues to elevate the data and transaction processing needs of financial institutions. We expect that financial institutions will continue to invest significant capital and human resources to process transactions, manage information, maintain regulatory compliance and offer innovative new services to their customers in this rapidly evolving and competitive environment. We anticipate that we will benefit over the long term from the trend of financial institutions moving from in-house technology to outsourced solutions as they seek to remain current on technology changes in an evolving marketplace. We believe that economies of scale in developing and maintaining the infrastructure, technology, products, services and networks necessary to be competitive in such an environment are essential to justify these investments, and we anticipate that demand for products that facilitate customer interaction with financial institutions, including electronic transactions through digital channels, will continue to increase, which we expect to create revenue opportunities for us.
In addition to the trends described above, the financial institutions marketplace has experienced change in composition as well. During the past 25 years, the number of financial institutions in the United States has declined at a relatively steady rate of approximately 3% per year, primarily as a result of voluntary mergers and acquisitions. Rather than reducing the overall market, these consolidations have transferred accounts among financial institutions. If a client loss occurs due to merger or acquisition, we receive a contract termination fee based on the size of the client and how early in the contract term the contract is terminated. These fees can vary from period to period with the variance depending on the quantum of financial institution merger activity in a given period and whether or not our clients are involved in the activity. Our focus on long-term client relationships and recurring, transaction-oriented products and services has also reduced the impact that consolidation in the financial services industry has had on us. We believe that the integration of our products and services creates a compelling value proposition for our clients by providing, among other things, new sources of revenue and opportunities to reduce their costs. Furthermore, we believe that our sizable and diverse client base, combined with our position as a leading provider of non-discretionary, recurring revenue-based products and services, gives us a solid foundation for growth.
Merchants
The rapid growth in and globalization of mobile and e-commerce, driven by consumers’ desire for simpler, more efficient shopping experiences, has created an opportunity for merchants to reach consumers in high-growth online and mobile settings, which often requires a merchant acquiring provider to enable and optimize the acceptance of payments. Merchants are demanding simpler, integrated and modern POS systems to help manage their everyday business operations. When combined with the ever-increasing ways a consumer can pay for goods and services, merchants have sought modern POS systems to streamline this complexity. Furthermore, merchants can now search, discover, compare, purchase and even install a new POS system through direct, digital-only experiences. This direct, digital-only channel is quickly becoming a source of new merchant acquisition opportunities, especially with respect to smaller merchants.
In addition, there are numerous software-as-a-service (“SaaS”) solutions in the industry, many of which have chosen to integrate merchant acquiring within their software as a way to further monetize their client relationships. SaaS solutions that integrate payments are often referred to as Independent Software Vendors (or “ISVs”), and we believe there are thousands of these potential distribution partnership opportunities available to us.
We believe that our merchant acquiring products and solutions create compelling value propositions for merchant clients of all sizes, from small and mid-sized businesses (or “SMBs”) to medium-sized regional businesses to global enterprise merchants, and across all verticals. Furthermore, we believe that our sizable and diverse client base, combined with valued partnerships with merchant acquiring businesses of small, medium and large financial institutions, and non-financial institutions, gives us a solid foundation for growth.
Recent Market Conditions
In 2019, a novel strain of coronavirus (“COVID-19”) was identified and has since continued to spread. In March 2020, the World Health Organization recognized the COVID-19 outbreak as a pandemic. In response to the COVID-19 pandemic, the governments of many countries, states, cities and other geographic regions have taken actions to prevent the spread of COVID-19, such as imposing travel restrictions and bans, quarantines, social distancing guidelines, shelter-in-place or lock-down orders and other similar limitations, adversely impacting global economic activity and contributing to significant volatility in financial markets. From time to time during the second half of 2020 and into 2021, some jurisdictions have eased restrictions in an effort to reopen their economies. While this has been successful in some places, others have had to reinstate restrictions to curb the spread of the virus.
We have taken several actions since the onset of the pandemic to protect the health, safety and well-being of our employees while maintaining business continuity. These actions include, among others, requiring a majority of our employees to work remotely, eliminating non-essential travel, suspending all non-essential visitors to our facilities, disinfecting facilities and workspaces extensively and frequently, providing personal protective equipment to associates and requiring employees who
must be present at our facilities to adhere to a variety of safety protocols. In addition, we have expanded paid time-off for employees impacted by COVID-19, provided increased pay for certain employees involved in critical infrastructure who could not work remotely, and expanded our Fiserv Cares program to benefit employees in need around the world. We expect to continue such safety measures for the foreseeable future and may take further actions, or adapt these existing policies, as government authorities may require or recommend or as we may determine to be in the best interest of our employees, clients and vendors.
Our operating performance is subject to global economic and market conditions, as well as their impacts on levels of consumer and business spending. As a result of the COVID-19 pandemic and the related decline in global economic activity, we experienced a significant decrease in payments volume and transactions beginning in late March 2020 that negatively impacted our merchant acquiring and payment-related businesses, which earn transaction-based fees, as well as modest declines in other businesses. Merchant acquiring transaction and payment volumes began to partially recover in May 2020 and continued to improve into July 2020; thereafter, the monthly volume growth rate as compared to the prior year stabilized for the balance of the year. While recent business trends demonstrate positive momentum, the uncertainty caused by the pandemic creates an economic environment where our future financial results remain difficult to anticipate. We currently expect payments volume and transactions to continue to improve throughout 2021.
Throughout 2020, we also took several actions to manage discretionary costs including, among others, limiting the hiring of new employees, limiting third-party spending and the temporary suspension of certain employee-related benefits, including company matching contributions to the Fiserv 401(k) Savings Plan as well as the discount on shares purchased under the Fiserv, Inc. Amended and Restated Employee Stock Purchase Plan. Effective January 1, 2021, company matching contributions were re-established to equal 100% on the first 1% contributed and 25% on the next 4% contributed for eligible participants. In addition, we reassessed and deferred certain capital expenditures that were originally planned for 2020. We will continue to monitor and assess developments related to COVID-19 and implement appropriate actions to minimize the risk to our operations of any material adverse developments. Ultimately, the extent of the impact of the COVID-19 pandemic on our future operational and financial performance will depend on, among other matters, the duration and intensity of the COVID-19 pandemic; governmental and private sector responses to the pandemic and the impact of such responses on us; the level of success of global vaccination efforts; and the impact of the pandemic on our employees, clients, vendors, operations and sales, all of which are uncertain and cannot be predicted.
Critical Accounting Policies and Estimates
Our consolidated financial statements and accompanying notes have been prepared in accordance with accounting principles generally accepted in the United States, which require management to make estimates, judgments and assumptions that affect the reported amount of assets, liabilities, revenue and expenses. We continually evaluate the accounting policies and estimates that we use to prepare our consolidated financial statements, including for recently adopted accounting pronouncements, and base our estimates on historical experience and assumptions that we believe are reasonable in light of current circumstances. Actual amounts and results could differ materially from these estimates.
Acquisitions
From time to time, we make strategic acquisitions that may have a material impact on our consolidated results of operations or financial position. We allocate the purchase price of acquired businesses to the assets acquired and liabilities assumed in the transaction at their estimated fair values. The estimates used to determine the fair value of long-lived assets, such as intangible assets, can be complex and require significant judgments. We use information available to us to make fair value determinations and engage independent valuation specialists, when necessary, to assist in the fair value determination of significant acquired long-lived assets. The determination of fair value requires estimates about discount rates, growth and retention rates, royalty rates, expected future cash flows and other future events that are judgmental in nature. While we use our best estimates and assumptions as a part of the purchase price allocation process, our estimates are inherently uncertain and subject to refinement. As a result, during the measurement period, which may be up to one year from the acquisition date, we record adjustments to the assets acquired and liabilities assumed, with the corresponding offset to goodwill. Upon the conclusion of the measurement period or final determination of the values of assets acquired or liabilities assumed, whichever comes first, any subsequent adjustments are recorded to our consolidated statements of income. We are also required to estimate the useful lives of intangible assets to determine the amount of acquisition-related intangible asset amortization expense to record in future periods. We periodically review the estimated useful lives assigned to our intangible assets to determine whether such estimated useful lives continue to be appropriate. Additional information regarding our acquisitions is included in Note 4 to the consolidated financial statements.
Goodwill and Intangible Assets
We review the carrying value of goodwill for impairment annually, or more frequently if events or circumstances indicate the carrying value may not be recoverable. Goodwill is tested for impairment at a reporting unit level, which is one level below our reportable segments. When reviewing goodwill for impairment, we consider the prior test’s amount of excess fair value over the carrying value of each reporting unit, the period of time since a reporting unit’s last quantitative test, the extent a reorganization or disposition changes the composition of one or more of our reporting units, and other factors to determine whether or not to first perform a qualitative test. When performing a qualitative test, we assess numerous factors to determine whether it is more likely than not that the fair value of our reporting units are less than their respective carrying values. Examples of qualitative factors that we assess include our share price, our financial performance, market and competitive factors in our industry and other events specific to our reporting units. If we conclude that it is more likely than not that the fair value of a reporting unit is less than its carrying value, we perform a quantitative impairment test.
The quantitative impairment test compares the estimated fair value of the reporting unit to its carrying value, and recognizes an impairment loss for the amount by which a reporting unit’s carrying amount exceeds its fair value, without exceeding the total amount of goodwill allocated to that reporting unit. We determine the fair value of a reporting unit using both a discounted cash flow analysis and a market approach. Determining the fair value of a reporting unit involves judgment and the use of significant estimates and assumptions, which include assumptions regarding the revenue growth rates and operating margins used to calculate estimated future cash flows, risk-adjusted discount rates and future economic and market conditions.
In connection with the Segment Realignment, certain of our reporting units changed in composition in which goodwill was allocated to such reporting units using a relative fair value approach. Accordingly, we performed an interim goodwill impairment assessment in the first quarter of 2020 for those reporting units impacted by the Segment Realignment and determined that our goodwill was not impaired based on an assessment of various qualitative factors, as described above. Our most recent annual impairment assessment of our reporting units in the fourth quarter of 2020 determined that our goodwill of $36 billion was not impaired as the estimated fair values of the respective reporting units exceeded the carrying values. However, for four of our reporting units that were acquired as part of the First Data acquisition, with aggregate goodwill of $12 billion, the excess of the respective reporting unit’s fair value over carrying value ranged from 14 to 21 percent. If future operating performance is below our expectations or there are changes to forecasted revenue growth rates, risk-adjusted discount rates, effective income tax rates, or some combination thereof, a decline in the fair value of the reporting units could result in, and we may be required to record, a goodwill impairment charge. It is also reasonably possible that future developments related to the economic impact of the COVID-19 pandemic on certain of our recently acquired (recorded at fair value) First Data businesses, such as an increased duration and intensity of the pandemic and/or government-imposed shutdowns, prolonged economic downturn or recession, or lack of governmental support for recovery, could have a future material impact on one or more of the estimates and assumptions used to evaluate goodwill impairment. We have no accumulated goodwill impairment through December 31, 2020. Additional information regarding our goodwill is included in Note 8 to the consolidated financial statements.
We review intangible assets for impairment whenever events or changes in circumstances indicate the carrying amount of the asset may not be recoverable. We review capitalized software development costs for impairment at each reporting date. Recoverability of intangible assets is assessed by comparing the carrying amount of the asset to either the undiscounted future cash flows expected to be generated by the asset or the net realizable value of the asset, depending on the type of asset. Determining future cash flows and net realizable values involves judgment and the use of significant estimates and assumptions regarding future economic and market conditions. Measurement of any impairment loss is based on estimated fair value. Given the significance of our goodwill and intangible asset balances, an adverse change in fair value could result in an impairment charge, which could be material to our consolidated financial statements.
Revenue Recognition
Revenue is measured based on consideration specified in a contract with a customer, and excludes any amounts collected on behalf of third parties. As a practical expedient, we do not adjust the transaction price for the effects of a significant financing component if, at contract inception, the period between customer payment and the transfer of goods or services is expected to be one year or less. Contracts with customers are evaluated on a contract-by-contract basis as contracts may include multiple types of goods and services as described below.
Processing and Services
Processing and services revenue is generated from account- and transaction-based fees for data processing, merchant transaction processing and acquiring, electronic billing and payment services, electronic funds transfer and debit/credit processing services; consulting and professional services; and software maintenance for ongoing client support.
We recognize processing and services revenues in the period in which the specific service is performed unless they are not deemed distinct from other goods or services, in which case revenue would then be recognized as control is transferred of the combined goods and services. Our arrangements for processing and services typically consist of an obligation to provide specific services to our customers on a when- and if-needed basis (a stand-ready obligation) and revenue is recognized from the satisfaction of the performance obligations in the amount billable to the customer. These services are typically provided under a fixed or declining (tier-based) price per unit based on volume of service; however, pricing for services may also be based on minimum monthly usage fees. Fees for our processing and services arrangements are typically billed and paid on a monthly basis.
Product
Product revenue is generated from print and card production sales, as well as software license sales. For software license agreements that are distinct, we recognize software license revenue upon delivery, assuming a contract is deemed to exist. Revenue for arrangements with customers that include significant customization, modification or production of software such that the software is not distinct is typically recognized over time based upon efforts expended, such as labor hours, to measure progress towards completion. For arrangements involving hosted licensed software for the customer, a software element is considered present to the extent the customer has the contractual right to take possession of the software at any time during the hosting period without significant penalty and it is feasible for the customer to either operate the software on their own hardware or contract with another vendor to host the software.
We also sell or lease hardware (POS devices) and other peripherals as part of our contracts with customers. Hardware typically consists of terminals or Clover devices. We do not manufacture hardware, rather we purchase hardware from third-party vendors and hold such hardware in inventory until purchased by a customer. We account for sales of hardware as a separate performance obligation and recognize the revenue at its standalone selling price when the customer obtains control of the hardware.
Significant Judgments
We use the following methods, inputs and assumptions in determining amounts of revenue to recognize. For multi-element arrangements, we account for individual goods or services as a separate performance obligation if they are distinct, the good or service is separately identifiable from other items in the arrangement, and if a customer can benefit from the good or service on its own or with other resources that are readily available to the customer. If these criteria are not met, the promised goods or services are accounted for as a combined performance obligation. Determining whether goods or services are distinct performance obligations that should be accounted for separately may require significant judgment.
Technology or service components from third parties are frequently embedded in or combined with our applications or service offerings. Whether we recognize revenue based on the gross amount billed to a customer or the net amount retained involves judgment that depends on the relevant facts and circumstances including the level of contractual responsibilities and obligations for delivering solutions to end customers.
The transaction price is determined based on the consideration to which we will be entitled in exchange for transferring products or services to the customer. We include any fixed charges within our contracts as part of the total transaction price. To the extent that variable consideration is not constrained, we include an estimate of the variable amount, as appropriate, within the total transaction price and update our assumptions over the duration of the contract. We may constrain the estimated transaction price in the event of a high degree of uncertainty as to the final consideration amount owed because of an extended length of time over which the fees may be adjusted. The transaction price (including any discounts or rebates) is allocated between distinct goods and services in a multi-element arrangement based on their relative standalone selling prices. For items that are not sold separately, we estimate the standalone selling prices using available information such as market conditions and internally approved pricing guidelines. Significant judgment may be required to determine standalone selling prices for each performance obligation and whether it depicts the amount we expect to receive in exchange for the related good or service.
Contract modifications occur when we and our customers agree to modify existing customer contracts to change the scope or price (or both) of the contract or when a customer terminates some, or all, of the existing services provided by us. When a contract modification occurs, it requires us to exercise judgment to determine if the modification should be accounted for as (i) a separate contract, (ii) the termination of the original contract and creation of a new contract, or (iii) a cumulative catch up adjustment to the original contract. Further, contract modifications require the identification and evaluation of the performance obligations of the modified contract, including the allocation of revenue to the remaining performance obligations and the period of recognition for each identified performance obligation.
Additional information regarding our revenue recognition policies is included in Note 3 to the consolidated financial statements.
Income Taxes
The determination of our provision for income taxes requires management’s judgment in the use of estimates and the interpretation and application of complex tax laws, sometimes made more complex by our global footprint. Judgment is also required in assessing the timing and amounts of deductible and taxable items. We establish a liability for known tax exposures relating to deductions, transactions and other matters involving some uncertainty as to the proper tax treatment of the item. In establishing a liability for known tax exposures, assumptions are made in determining whether, and the extent to which, a tax position will be sustained. A tax benefit with respect to a tax position is recognized only when it is more likely than not to be sustained upon examination by the relevant taxing authority, based on its technical merits, considering the facts and circumstances available as of the reporting date. The amount of tax benefit recognized reflects the largest benefit that we believe is more likely than not to be realized on settlement with the relevant taxing authority. As new information becomes available, we evaluate our tax positions and adjust our liability for known tax exposures as appropriate.
We maintain net operating loss carryforwards in various taxing jurisdictions, resulting in the establishment of deferred tax assets. We establish a valuation allowance against our deferred tax assets when, based upon the weight of all available evidence, we believe it is more likely than not that some portion or all of the deferred tax assets will not be realized. In making this determination, we have considered the relative impact of all of the available positive and negative evidence regarding future sources of taxable income and available tax planning strategies. However, there could be a material impact to our effective tax rate if there is a significant change in our judgment. To the extent our judgment changes, the valuation allowances are then adjusted, generally through the provision for income taxes, in the period in which the change in facts and circumstances occurs. Additional information regarding our income taxes is included in Note 18 to the consolidated financial statements.
Results of Operations
Components of Revenue and Expenses
The following summary describes the components of revenue and expenses as presented in our consolidated statements of income.
Processing and Services
Processing and services revenue, which in 2020 represented 82% of our total revenue, is primarily generated from account- and transaction-based fees under multi-year contracts. Processing and services revenue is most reflective of our business performance as a significant amount of our total operating profit is generated by these services. Cost of processing and services includes costs directly associated with providing services to clients and includes the following: personnel; equipment and data communication; infrastructure costs, including costs to maintain software applications; client support; certain depreciation and amortization; and other operating expenses.
Product
Product revenue, which in 2020 represented 18% of our total revenue, is primarily derived from print and card production sales, as well as software license sales and hardware (POS devices) sales. Cost of product includes costs directly associated with the products sold and includes the following: costs of materials and software development; hardware; personnel; infrastructure costs; certain depreciation and amortization; and other costs directly associated with product revenue.
Selling, General and Administrative Expenses
Selling, general and administrative expenses primarily consist of: salaries, wages, commissions and related expenses paid to sales personnel, administrative employees and management; advertising and promotional costs; certain depreciation and amortization; and other selling and administrative expenses.
Synergies from the First Data Acquisition
Following the acquisition of First Data, we continue to implement our post-merger integration plans to achieve synergies from future expected economic benefits, including enhanced revenue growth from expanded capabilities and geographic presence as well as substantial cost savings from duplicative overhead, streamlined operations and enhanced operational efficiency. At December 31, 2020, we have achieved a significant portion of revenue and cost synergies and expect to meet or exceed our previously announced targets.
Financial Results
The following table presents certain amounts included in our consolidated statements of income, the relative percentage that those amounts represent to revenue and the change in those amounts from year-to-year. This information should be read together with the consolidated financial statements and accompanying notes. The financial results presented below have been affected by the acquisition of First Data and other acquisitions, dispositions, debt financing activities, and foreign currency fluctuations. The amounts from the acquired First Data businesses were included in our results for the full year in 2020 and for the five months, since the July 29,2019 acquisition date, in 2019. | | | | | | | | | | | | | | | | | | | | | | | | | | | | | | | | | | | | | | | | | | | | | | | | | | | | | | | | | | | |
| | | | | | | | | | | | | | | | | | | |
| (In millions) | | | Percentage of Revenue (1) | | Increase (Decrease) |
| Year Ended December 31, | 2020 | | 2019 | | 2018 | | 2020 | | 2019 | | 2018 | | 2020 vs. 2019 | | 2019 vs. 2018 |
| Revenue: | | | | | | | | | | | | | | | | | | | |
| Processing and services | $ | 12,215 | | | $ | 8,573 | | | $ | 4,975 | | | 82.2 | % | | 84.2 | % | | 85.4 | % | | $ | 3,642 | | | 42 | % | | $ | 3,598 | | | 72 | % |
| Product | 2,637 | | | 1,614 | | | 848 | | | 17.8 | % | | 15.8 | % | | 14.6 | % | | 1,023 | | | 63 | % | | 766 | | | 90 | % |
| Total revenue | 14,852 | | | 10,187 | | | 5,823 | | | 100.0 | % | | 100.0 | % | | 100.0 | % | | 4,665 | | | 46 | % | | 4,364 | | | 75 | % |
| Expenses: | | | | | | | | | | | | | | | | | | | |
Cost of processing and services | 5,841 | | | 4,016 | | | 2,324 | | | 47.8 | % | | 46.8 | % | | 46.7 | % | | 1,825 | | | 45 | % | | 1,692 | | | 73 | % |
| Cost of product | 1,971 | | | 1,293 | | | 745 | | | 74.7 | % | | 80.1 | % | | 87.9 | % | | 678 | | | 52 | % | | 548 | | | 74 | % |
| Sub-total | 7,812 | | | 5,309 | | | 3,069 | | | 52.6 | % | | 52.1 | % | | 52.7 | % | | 2,503 | | | 47 | % | | 2,240 | | | 73 | % |
Selling, general and administrative | 5,652 | | | 3,284 | | | 1,228 | | | 38.1 | % | | 32.2 | % | | 21.1 | % | | 2,368 | | | 72 | % | | 2,056 | | | 167 | % |
Gain on sale of businesses | (464) | | | (15) | | | (227) | | | (3.1) | % | | (0.1) | % | | (3.9) | % | | 449 | | | n/m | | (212) | | | n/m |
| Total expenses | 13,000 | | | 8,578 | | | 4,070 | | | 87.5 | % | | 84.2 | % | | 69.9 | % | | 4,422 | | | 52 | % | | 4,508 | | | 111 | % |
| Operating income | 1,852 | | | 1,609 | | | 1,753 | | | 12.5 | % | | 15.8 | % | | 30.1 | % | | 243 | | | 15 | % | | (144) | | | (8) | % |
| Interest expense, net | (709) | | | (473) | | | (189) | | | (4.8) | % | | (4.6) | % | | (3.2) | % | | 236 | | | 50 | % | | 284 | | | 150 | % |
Debt financing activities | — | | | (47) | | | (14) | | | — | % | | (0.5) | % | | (0.2) | % | | (47) | | | (100) | % | | 33 | | | 236 | % |
| Other income (expense) | 28 | | | (6) | | | 5 | | | 0.2 | % | | (0.1) | % | | 0.1 | % | | 34 | | | n/m | | (11) | | | n/m |
| Income before income taxes and income from investments in unconsolidated affiliates | 1,171 | | | 1,083 | | | 1,555 | | | 7.9 | % | | 10.6 | % | | 26.7 | % | | 88 | | | 8 | % | | (472) | | | (30) | % |
Income tax provision | (196) | | | (198) | | | (378) | | | (1.3) | % | | (1.9) | % | | (6.5) | % | | (2) | | | (1) | % | | (180) | | | (48) | % |
Income from investments in unconsolidated affiliates | — | | | 29 | | | 10 | | | — | % | | 0.3 | % | | 0.2 | % | | (29) | | | (100) | % | | 19 | | | 190 | % |
| | | | | | | | | | | | | | | | | | | |
| | | | | | | | | | | | | | | | | | | |
Net income | 975 | | | 914 | | | 1,187 | | | 6.6 | % | | 9.0 | % | | 20.4 | % | | 61 | | | 7 | % | | (273) | | | (23) | % |
| Less: net income attributable to noncontrolling interests and redeemable noncontrolling interests | 17 | | | 21 | | | — | | | 0.1 | % | | 0.2 | % | | — | % | | (4) | | | (19) | % | | 21 | | | n/m |
Net income attributable to Fiserv, Inc. | $ | 958 | | | $ | 893 | | | $ | 1,187 | | | 6.5 | % | | 8.8 | % | | 20.4 | % | | $ | 65 | | | 7 | % | | $ | (294) | | | (25) | % |
| | | | | | | | | | | | | | | | | | | |
(1)Percentage of revenue is calculated as the relevant revenue, expense, income or loss amount divided by total revenue, except for cost of processing and services and cost of product amounts, which are divided by the related component of revenue.
| | | | | | | | | | | | | | | | | | | | | | | | | | | | | | | | | | | | | | | | | | | | |
| | | | | | | | | | | | | | |
| (In millions) | |
| Year Ended December 31, | Acceptance | | Fintech | | Payments | | Corporate
and Other | | Total |
| Total revenue: | | | | | | | | | | | | | | |
| 2020 | $ | 5,522 | | | | $ | 2,901 | | | | $ | 5,504 | | | | $ | 925 | | | | $ | 14,852 | | |
| 2019 | 2,571 | | | | 2,942 | | | | 3,909 | | | | 765 | | | | 10,187 | | |
| 2018 | — | | | | 2,917 | | | | 2,408 | | | | 498 | | | | 5,823 | | |
| | | | | | | | | | | | | | |
| Revenue growth: | | | | | | | | | | | | | | |
| 2020 | $ | 2,951 | | | | $ | (41) | | | | $ | 1,595 | | | | $ | 160 | | | | $ | 4,665 | | |
| 2020 percentage | 115 | % | | | (1) | % | | | 41 | % | | | | | | 46 | % | |
| 2019 | $ | 2,571 | | | | $ | 25 | | | | $ | 1,501 | | | | $ | 267 | | | | $ | 4,364 | | |
| 2019 percentage | | | | 1 | % | | | 62 | % | | | | | | 75 | % | |
| | | | | | | | | | | | | | |
| Operating income: | | | | | | | | | | | | | | |
| 2020 | $ | 1,427 | | | | $ | 992 | | | | $ | 2,361 | | | | $ | (2,928) | | | | $ | 1,852 | | |
| 2019 | 764 | | | | 885 | | | | 1,658 | | | | (1,698) | | | | 1,609 | | |
| 2018 | — | | | | 851 | | | | 1,081 | | | | (179) | | | | 1,753 | | |
| | | | | | | | | | | | | | |
| Operating income growth: | | | | | | | | | | | | | | |
| 2020 | $ | 663 | | | | $ | 107 | | | | $ | 703 | | | | $ | (1,230) | | | | $ | 243 | | |
| 2020 percentage | 87 | % | | | 12 | % | | | 42 | % | | | | | | 15 | % | |
| 2019 | $ | 764 | | | | $ | 34 | | | | $ | 577 | | | | $ | (1,519) | | | | $ | (144) | | |
| 2019 percentage | | | | 4 | % | | | 53 | % | | | | | | (8) | % | |
| | | | | | | | | | | | | | |
| Operating margin: | | | | | | | | | | | | | | |
| 2020 | 25.9 | % | | | 34.2 | % | | | 42.9 | % | | | | | | 12.5 | % | |
| 2019 | 29.7 | % | | | 30.1 | % | | | 42.4 | % | | | | | | 15.8 | % | |
| 2018 | — | % | | | 29.2 | % | | | 44.9 | % | | | | | | 30.1 | % | |
| | | | | | | | | | | | | | |
Operating margin growth: (1) | | | | | | | | | | | | | | |
| 2020 | (380) | | bps | | 410 | | bps | | 50 | | bps | | | | | (330) | | bps |
| 2019 | | | | 90 | | bps | | (250) | | bps | | | | | (1,430) | | bps |
| | | | | | | | | | | | | | |
(1)Represents the basis point growth or decline in operating margin.
Operating margin percentages are calculated using actual, unrounded amounts.
Total Revenue
Total revenue increased $4,665 million, or 46%, in 2020 and increased $4,364 million, or 75%, in 2019 compared to the prior years, primarily driven by the incremental revenue from the First Data acquisition. The First Data acquisition, which was completed on July 29, 2019, contributed $5,067 million and $4,078 million of incremental revenue during 2020 and 2019, respectively, with $3,114 million and $2,571 million to the Acceptance segment, $1,616 million and $1,230 million to the Payments segment, and $337 million and $277 million to Corporate and Other, during 2020 and 2019, respectively. Conversely, dispositions reduced revenue by $348 million and $54 million in 2020 and 2019, respectively, compared to the prior years.
Revenue in our Acceptance segment increased $2,951 million, or 115%, in 2020, driven by the acquisition of First Data on July 29, 2019, which contributed incremental revenue of $3,114 million during the first seven months of 2020 and the entire $2,571 million of Acceptance segment revenue in 2019. The dissolution of the BAMS joint venture on July 1, 2020 reduced Acceptance segment revenue growth in 2020 by 6% compared to 2019. In addition, revenue in our Acceptance segment, which earns transaction-based fees, was adversely affected by the economic impact of the COVID-19 pandemic in the last two weeks of March 2020 and throughout the remainder of the year. Merchant acquiring transaction and payment volumes began to partially recover in May 2020 and continued to improve into July 2020; thereafter, the monthly volume growth rate as compared to the prior year stabilized for the balance of the year.
Revenue in our Fintech segment decreased $41 million, or 1%, in 2020 and increased $25 million, or 1%, in 2019 compared to the prior years. Dispositions, including our remittance solutions business in December 2019 and Lending Solutions business in March 2018, reduced Fintech segment revenue growth by 1% and 2% in 2020 and 2019, respectively, compared to the prior years. Recurring revenue growth from higher processing volumes in 2020 was offset by a reduction of 2% from a decline in termination fee revenue. Fintech segment revenue growth in 2019 was driven by growth in our bank solutions business from new business, customer migrations from in-house technology to outsourced solutions and growth with existing customers across a range of products.
Revenue in our Payments segment increased $1,595 million, or 41%, in 2020 and increased $1,501 million, or 62%, in 2019 compared to the prior years. Revenue from acquired businesses, including First Data, contributed 41% and 57% to Payments segment revenue growth in 2020 and 2019, respectively. Payments segment revenue in 2020 was adversely affected by the COVID-19 pandemic while the remaining growth in 2019 was driven by expansion in our recurring revenue businesses, with our card services and electronic payments businesses contributing 4% and 1%, respectively.
Revenue at Corporate and Other increased $160 million, or 21%, in 2020 and increased $267 million, or 54%, in 2019 compared to the prior years. Postage revenue from the First Data acquisition contributed 44% and 56% to the Corporate and Other growth in 2020 and 2019, respectively, while the disposition of a 60% controlling interest of our Investment Services business reduced revenue growth by 19% in 2020.
Total Expenses
Total expenses increased $4,422 million, or 52%, in 2020 and increased $4,508 million, or 111%, in 2019 compared to the prior years. Total expenses as a percentage of total revenue was 87.5%, 84.2% and 69.9% in 2020, 2019 and 2018, respectively. Total expenses in 2020 and 2019 contain the incremental expenses, including acquired intangible asset amortization, of First Data from the date of acquisition, resulting in the overall significant increase in expenses compared to the prior years. The incremental expenses during 2020 from the First Data acquisition were primarily due to 2020 containing seven more months of expenses from First Data as compared to 2019. Total expenses were reduced by a $428 million gain on sale of a 60% interest of our Investment Services business and a $36 million gain on the dissolution of the BAMS joint venture in 2020, and a $227 million gain on sale of a 55% interest of our Lending Solutions business in 2018.
Cost of processing and services as a percentage of processing and services revenue was 47.8%, 46.8% and 46.7% in 2020, 2019 and 2018, respectively. Expense management in our recurring revenue businesses favorably impacted cost of processing and services as a percentage of processing and services revenue in both 2020 and 2019 compared to the prior years. Conversely, cost of processing and services as a percentage of processing and services revenue increased in 2020 by approximately 200 basis points, from integration-related expenses associated with the First Data acquisition, including $118 million of accelerated depreciation and amortization associated with the termination of certain vendor contracts, and by approximately 100 basis points from incremental First Data acquisition intangible amortization. Cost of processing and services as a percentage of processing and services revenue increased in 2019 by approximately 70 basis points from expenses shifting from cost of product to cost of processing as financial institutions continue to move from in-house technology to outsourced solutions, and by approximately 60 basis points from a non-cash impairment charge related to an international core processing platform. Client-focused incremental investments increased cost of processing and services as a percentage of processing and services revenue in 2018 by approximately 50 basis points.
Cost of product as a percentage of product revenue was 74.7%, 80.1% and 87.9% in 2020, 2019 and 2018, respectively. The reduction in cost of product as a percentage of product revenue in 2020 and 2019 was driven by the First Data acquisition. In addition, cost of product as a percentage of product revenue in 2019 decreased by approximately 400 basis points due to expenses shifting from cost of product to cost of processing and services as financial institutions continue to move from in-house technology to outsourced solutions, and increased by approximately 300 basis points from a decrease in higher-margin software license revenue as compared to 2018.
Selling, general and administrative expenses as a percentage of total revenue was 38.1%, 32.2% and 21.1% in 2020, 2019 and 2018, respectively. Incremental acquired intangible asset amortization from the First Data acquisition increased selling, general and administrative expenses as a percentage of total revenue by approximately 600 basis points in each of 2020 and 2019. Selling, general and administrative expenses as a percentage of total revenue in 2020 increased by approximately 120 basis points from higher integration-related expenses, which was largely offset by synergy related cost reductions. The remaining increase in 2019 was due to increased costs associated with the First Data acquisition, including integration-related expenses.
The gains on sale of businesses of $464 million, $15 million and $227 million in 2020, 2019 and 2018, respectively, primarily resulted from the sale of a 60% interest of our Investment Services business in February 2020, the dissolution of the BAMS joint venture in July 2020, and the sale of a 55% interest of our Lending Solutions business in March 2018, including contingent consideration received in 2019.
Operating Income and Operating Margin
Total operating income increased $243 million, or 15%, in 2020 and decreased $144 million, or 8%, in 2019 compared to the prior years. Total operating margin decreased to 12.5% in 2020 from 15.8% in 2019 and 30.1% in 2018.
Operating income in our Acceptance segment was $764 million in 2019 and increased $663 million, or 87%, in 2020, driven by the acquisition of First Data. Operating margin was 25.9% and 29.7% in 2020 and 2019, respectively, decreasing 380 basis points in 2020 compared to the prior year. Operating income and margin in our Acceptance segment, which earns transaction-based fees, was adversely affected in the last two weeks of March and throughout the remainder of 2020 due to the economic impact of the COVID-19 pandemic. Merchant acquiring transaction and payment volumes and related operating income began to partially recover in May 2020 and continued to improve into July 2020; thereafter, the monthly volume growth rate as compared to the prior year stabilized for the balance of the year.
Operating income in our Fintech segment increased $107 million, or 12%, in 2020 and increased $34 million, or 4%, in 2019 compared to the prior years. Operating margin was 34.2%, 30.1% and 29.2% in 2020, 2019 and 2018, respectively, increasing 410 basis points in 2020 and increasing 90 basis points in 2019 compared to the prior years. Fintech segment operating margin improvement in 2020 compared to 2019 was driven by expense management across the segment, including technology and vendor synergy savings of approximately 330 basis points and additional expense reductions attributable to the COVID-19 pandemic of approximately 120 basis points, partially offset by approximately 100 basis points from a reduction in contract termination fee revenue. Fintech segment operating margin improvement in 2019 compared to 2018 was driven by expense management efforts in our Fintech international businesses of approximately 100 basis points, partially offset by approximately 70 basis points from a reduction in higher-margin software license revenue. Client-focused incremental investments reduced Fintech segment operating margin in 2018 by approximately 40 basis points.
Operating income in our Payments segment increased $703 million, or 42%, in 2020 and increased $577 million, or 53%, in 2019 compared to the prior years. Operating margin was 42.9%, 42.4% and 44.9% in 2020, 2019 and 2018, respectively, increasing 50 basis points in 2020 and decreasing 250 basis points in 2019 compared to the prior years. The reduction in Payments segment operating margin in 2019 was primarily attributable to the acquisition of First Data, while the impact of cost synergies drove the margin expansion in 2020.
The operating loss in Corporate and Other increased $1,230 million in 2020 and increased $1,519 million in 2019 compared to the prior years. The increase in Corporate and Other operating loss was primarily due to the acquisition of First Data, including incremental amortization of acquired intangible assets of $1,035 million and $799 million in 2020 and 2019, respectively, incremental acquisition and integration-related costs of $441 million and $275 million in 2020 and 2019, respectively, and other First Data related corporate expenses since the date of acquisition. Corporate and Other was favorably impacted by gains from sales of businesses of $464 million, $15 million and $227 million in 2020, 2019 and 2018, respectively, and negatively impacted in 2019 by a $48 million non-cash impairment charge related to an international core processing platform.
Interest Expense, Net
Interest expense, net increased $236 million, or 50%, in 2020 and increased $284 million, or 150%, in 2019 compared to prior years, primarily due to the June 2019 issuance of $9.0 billion of fixed-rate senior notes, the July 2019 issuance of €1.5 billion and £1.05 billion of fixed-rate senior notes and the term loan borrowings that were incurred for the purpose of funding the repayment of certain indebtedness of First Data and its subsidiaries on the closing date of the acquisition, as well as the September 2018 issuance of $2.0 billion of fixed-rate notes.
Debt Financing Activities
In connection with the merger agreement entered into on January 16, 2019 to acquire First Data, we entered into a bridge facility commitment letter providing for a 364-day senior unsecured bridge term loan facility in an aggregate principal amount of $17.0 billion for the purpose of refinancing certain indebtedness of First Data on the closing date of the acquisition. We recorded $98 million of expense in 2019 associated with the bridge term loan facility and other refinancing and related activities in connection with the acquisition of First Data. In addition, in 2019 we recorded $50 million of net foreign currency transaction gains related to our foreign currency-denominated debt. In 2018, we completed a cash tender offer for and redemption of our then-outstanding $450 million aggregate principal amount of 4.625% senior notes due 2020, which resulted in a pre-tax loss on early debt extinguishment of $14 million.
Other Income (Expense)
Other income (expense) increased $34 million in 2020 and decreased $11 million in 2019 compared to prior years. Other income (expense) includes net foreign currency transaction gains and losses, gains or losses from a change in fair value of investments in certain equity securities, and amounts related to the release of risk under our non-contingent guarantee arrangements and changes in the provision of estimated credit losses associated with certain indebtedness of the Lending Joint Ventures. In addition, other income includes $19 million in 2020 related to a pre-tax gain on the sale of certain lease receivables.
Income Tax Provision
Income tax provision as a percentage of income before income from investments in unconsolidated affiliates was 16.7%, 18.3% and 24.3% in 2020, 2019 and 2018, respectively. The decrease in the effective tax rate in 2020 compared to 2019 was primarily the result of foreign income tax benefits from a subsidiary restructuring, partially offset by the impact of an increase in the United Kingdom corporate income tax rate from 17% to 19% in 2020. The decrease in the effective tax rate in 2019 compared to the prior year is primarily related to equity compensation-related tax benefits, as well as discrete benefits due to a loss from subsidiary restructuring.
Income from Investments in Unconsolidated Affiliates
Our share of net income or loss from affiliates accounted for using the equity method of accounting, including merchant bank alliance affiliates from the acquisition of First Data, is reported as income from investments in unconsolidated affiliates and the related tax expense or benefit is reported within the income tax provision in the consolidated statements of income. Income from investments in unconsolidated affiliates, including acquired intangible asset amortization from valuations in purchase accounting, was $0 million, $29 million and $10 million in 2020, 2019 and 2018, respectively.
Net Income Attributable to Noncontrolling Interests
Net income attributable to noncontrolling interests and redeemable noncontrolling interests relates to the ownership interest of our alliance partners in our consolidated results, obtained through the acquisition of First Data. Net income attributable to noncontrolling interests, including acquired intangible asset amortization from valuations in purchase accounting, was $17 million and $21 million in 2020 and 2019, respectively.
Net Income Per Share - Diluted
Net income attributable to Fiserv, Inc. per share-diluted was $1.40, $1.71 and $2.87 in 2020, 2019 and 2018, respectively. Net income attributable to Fiserv, Inc. per share-diluted in 2020 included integration costs and acquired intangible asset amortization from the application of purchase accounting associated with the acquisition of First Data, as well as gains from the sale of a 60% interest of our Investment Services business in February 2020 and the dissolution of the BAMS joint venture in July 2020. Net income attributable to Fiserv, Inc. per share-diluted in 2019 included transaction costs and financing activities associated with the acquisition of First Data, as well as integration costs and acquired asset amortization after the date of acquisition. Net income attributable to Fiserv, Inc. per share-diluted was favorably impacted in 2018 by a gain on the sale of a 55% interest of our Lending Solutions business.
Liquidity and Capital Resources
General
Our primary liquidity needs in the ordinary course of business are to: (i) fund normal operating expenses; (ii) meet the interest and principal requirements of our outstanding indebtedness, including finance leases; and (iii) fund capital expenditures and operating lease payments. We believe these needs will be satisfied using cash flow generated by our operations, along with our cash and cash equivalents of $906 million and available borrowings under our revolving credit facility of $3.4 billion at December 31, 2020. The following table summarizes our operating cash flow and capital expenditure amounts for the years ended December 31, 2020 and 2019, respectively. | | | | | | | | | | | | | | | | | | | | | | | |
| | | | | | | |
| Year Ended
December 31, | | Increase (Decrease) |
| (In millions) | 2020 | | 2019 | | $ | | % |
| Net income | $ | 975 | | | $ | 914 | | | $ | 61 | | | |
| Depreciation and amortization | 3,257 | | | 1,778 | | | 1,479 | | | |
| Net foreign currency gain on financing activities | — | | | (50) | | | 50 | | | |
| Share-based compensation | 369 | | | 229 | | | 140 | | | |
| | | | | | | |
| Deferred income taxes | 71 | | | 47 | | | 24 | | | |
| Gain on sale of businesses | (464) | | | (15) | | | (449) | | | |
| Income from investments in unconsolidated affiliates | — | | | (29) | | | 29 | | | |
| Distributions from unconsolidated affiliates | 42 | | | 23 | | | 19 | | | |
| Settlement of interest rate hedge contracts | — | | | (183) | | | 183 | | | |
| Non-cash impairment charges | 124 | | | 48 | | | 76 | | | |
| Net changes in working capital and other | (227) | | | 33 | | | (260) | | | |
| Operating cash flow | $ | 4,147 | | | $ | 2,795 | | | $ | 1,352 | | | 48 | % |
Capital expenditures, including capitalized software and other intangibles | $ | 900 | | | $ | 721 | | | $ | 179 | | | 25 | % |
| | | | | | | |
Our net cash provided by operating activities, or operating cash flow, was $4.1 billion in 2020, an increase of 48% compared with $2.8 billion in 2019. This increase was primarily attributable to the acquisition of First Data. Net cash provided by operating activities in 2019 included a payment of $183 million associated with the settlement of treasury lock agreements related to refinancing certain indebtedness assumed as part of the First Data acquisition. Our current policy is to use our operating cash flow primarily to fund capital expenditures, share repurchases and acquisitions and to repay debt rather than to pay dividends. Our capital expenditures were approximately 6% and 7% of our total revenue in 2020 and 2019, respectively.
Share Repurchases
In December 2020, New Omaha Holdings L.P. ("New Omaha"), a shareholder of ours, completed an underwritten secondary public offering of 20.1 million shares of our common stock (the “offering”). We repurchased from the underwriters 1.8 million shares of our common stock that were subject to the offering. The share repurchase totaled $200 million and was funded with cash on hand. The repurchased shares were cancelled and no longer outstanding following the completion of the share repurchase. In 2019, we deferred share repurchases as of January 16, 2019 until the close of the First Data acquisition. We purchased a total of $1.6 billion and $394 million of our common stock in 2020 and 2019, respectively.
On November 19, 2020, our board of directors authorized the purchase of up to 60.0 million shares of our common stock. At December 31, 2020, we had approximately 65.7 million shares remaining under our current repurchase authorizations. Shares repurchased are generally held for issuance in connection with our equity plans.
Acquisitions and Dispositions
Acquisitions
On March 2, 2020, we acquired MerchantPro, an ISO that provides processing services, POS equipment and merchant cash advances to businesses across the United States. MerchantPro is included within the Acceptance segment and further expands our merchant services business. On March 18, 2020, we acquired Bypass, an ISO and innovator in enterprise POS systems for sports and entertainment venues, food service management providers and national restaurant chains. Bypass is included within the Acceptance segment and further enhances our omni-commerce capabilities, enabling enterprise businesses to deliver a seamless customer experience that spans physical and digital channels. On May 11, 2020, we acquired Inlet, a provider of secure digital delivery solutions for enterprise and middle-market billers’ invoices and statements. Inlet is included within the Payments segment and further enhances our digital bill payment strategy. We acquired these businesses for an aggregate purchase price of $167 million, net of $2 million of acquired cash, and including earn-out provisions estimated at a fair value of $45 million. We funded these acquisitions by utilizing a combination of available cash and existing availability under our revolving credit facility.
On July 29, 2019, we acquired First Data for a total purchase price of $46.5 billion by acquiring 100% of the First Data stock that was issued and outstanding as of the date of acquisition. As a result of the acquisition, First Data stockholders received 286 million shares of common stock of Fiserv, Inc., at an exchange ratio of 0.303 shares of Fiserv, Inc. for each share of First Data common stock, with cash paid in lieu of fractional shares. We also converted 15 million outstanding First Data equity awards into corresponding equity awards relating to common stock of Fiserv, Inc. in accordance with the exchange ratio. In addition, concurrent with the closing of the acquisition, we made a cash payment of $16.4 billion to repay existing First Data debt. We funded the transaction-related expenses and the repayment of First Data debt through a combination of available cash on-hand, proceeds from the issuance of senior notes, and term loan and revolving credit facility borrowings. The acquisition of First Data, included within the Acceptance and Payments segments, increases our footprint as a global payments and financial technology provider by expanding the portfolio of services provided to financial institutions, corporate and merchant clients and consumers.
On October 31, 2018, we acquired the debit card processing, ATM Managed Services, and MoneyPass® surcharge-free network of Elan Financial Services, a unit of U.S. Bancorp, for approximately $659 million including post-closing working capital adjustments, estimated contingent consideration related to earn-out provisions and future payments under a transition services agreement in excess of estimated fair value. This acquisition, included within the Payments segment, deepens our presence in debit card processing, broadens our client reach and scale and provides new solutions to enhance the value proposition for our existing debit solution clients.
On January 22, 2021, we acquired Ondot Systems, Inc., a digital experience platform provider for financial institutions. This acquisition, to be included within the Payments segment, will further expand our digital capabilities, enhancing our suite of integrated solutions spanning card-based payments, digital banking platforms, core banking, and merchant solutions to enable clients of all sizes to deliver frictionless, digital-first and personalized experiences to their customers.
Dispositions
Effective July 1, 2020, we and BANA dissolved the BAMS joint venture, of which we maintained a 51% controlling ownership interest. Upon dissolution of the joint venture’s operations, the joint venture transferred a proportionate share of value, primarily the client contracts, to each party via an agreed upon contractual separation. The remaining activities of the joint venture will consist of supporting the transition of the business to each party and an orderly wind down of remaining BAMS assets and liabilities. The revenues and expenses of the BAMS joint venture were consolidated into our financial results through the date of dissolution. The business transferred to us will continue to be operated and managed within our Acceptance segment.
We will continue to provide merchant processing and related services to former BAMS clients allocated to BANA, at BAMS pricing, through June 2023. We will also provide processing and other support services to new BANA merchant clients pursuant to a five-year non-exclusive agreement which, after June 2023, will also apply to the former BAMS clients allocated to BANA. In addition, both companies are entitled to certain transition services, at fair value, from each other through June 2023.
On February 18, 2020, we sold a 60% controlling interest of our Investment Services business, subsequently renamed as Tegra118, LLC. We received pre-tax proceeds of $578 million, net of related expenses, resulting in a pre-tax gain on the sale of $428 million, with a related tax expense of $112 million. The net proceeds from the sale were primarily used to repurchase shares of our common stock. On February 2, 2021, Tegra118 completed a merger with a third party, resulting in a dilution of our ownership interest in the combined new entity, Wealthtech Holdings, LLC.
In connection with the acquisition of First Data, we acquired two businesses which we intended to sell. In October 2019, we completed the sales, at acquired fair value, of these two businesses for aggregate proceeds of $133 million.
On March 29, 2018, we sold a 55% controlling interest of our Lending Solutions business, retaining 45% ownership interests in two joint ventures. We received gross sale proceeds of $419 million from the transactions. In August 2019, the Sagent Auto, LLC joint venture, formerly known as Fiserv Automotive Solutions, LLC, completed a merger with a third party, resulting in the dilution of our ownership interest to 31% in the combined entity, defi SOLUTIONS Group, LLC. The Lending Joint Ventures maintain variable-rate term loan facilities with aggregate outstanding borrowings of $385 million in senior unsecured debt and variable-rate revolving credit facilities with an aggregate borrowing capacity of $45 million with a syndicate of banks, which mature in March 2023. Outstanding borrowings on the revolving credit facilities at December 31, 2020 were $13 million. We have guaranteed this debt of the Lending Joint Ventures and do not anticipate that the Lending Joint Ventures will fail to fulfill their debt obligations. We maintain a liability for the estimated fair value of our non-contingent obligations to stand ready to perform over the term of the guarantee arrangements with the Lending Joint Ventures. Such guarantees will be amortized in future periods over the contractual term, based upon amounts to be received by us for the respective guarantees. In addition, we
maintain a contingent liability representing the current expected credit losses to which we are exposed. This contingent liability is estimated based on certain financial metrics of the Lending Joint Ventures and historical industry data, which is used to develop assumptions of the likelihood the guaranteed parties will default and the level of credit losses in the event a default occurs. We have not made any payments under the guarantees, nor have we been called upon to do so. In addition, in January 2018, we completed the sale of the retail voucher business acquired in our 2017 acquisition of Monitise for proceeds of £37 million ($50 million).
Indebtedness
Our debt consisted of the following at December 31: | | | | | | | | | | | | | | |
| | | | |
| (In millions) | | 2020 | | 2019 |
| Short-term and current maturities of long-term debt: | | | | |
| Lines of credit | | $ | 144 | | | $ | 150 | |
| Finance lease and other financing obligations | | 240 | | | 137 | |
| Total short-term and current maturities of long-term debt | | $ | 384 | | | $ | 287 | |
| | | | |
| Long-term debt: | | | | |
| 2.700% senior notes due June 2020 | | $ | — | | | $ | 850 | |
| 4.750% senior notes due June 2021 | | 400 | | | 400 | |
| 3.500% senior notes due October 2022 | | 700 | | | 700 | |
| 3.800% senior notes due October 2023 | | 1,000 | | | 1,000 | |
| 0.375% senior notes due July 2023 (Euro-denominated) | | 612 | | | 559 | |
| 2.750% senior notes due July 2024 | | 2,000 | | | 2,000 | |
| 3.850% senior notes due June 2025 | | 900 | | | 900 | |
| 2.250% senior notes due July 2025 (British Pound-denominated) | | 709 | | | 687 | |
| 3.200% senior notes due July 2026 | | 2,000 | | | 2,000 | |
| 2.250% senior notes due June 2027 | | 1,000 | | | — | |
| 1.125% senior notes due July 2027 (Euro-denominated) | | 612 | | | 559 | |
| 4.200% senior notes due October 2028 | | 1,000 | | | 1,000 | |
| 3.500% senior notes due July 2029 | | 3,000 | | | 3,000 | |
| 2.650% senior notes due June 2030 | | 1,000 | | | — | |
| 1.625% senior notes due July 2030 (Euro-denominated) | | 612 | | | 559 | |
| 3.000% senior notes due July 2031 (British Pound-denominated) | | 709 | | | 687 | |
| 4.400% senior notes due July 2049 | | 2,000 | | | 2,000 | |
| Receivable securitized loan | | 425 | | | 500 | |
| Term loan facility | | 1,250 | | | 3,950 | |
| Unamortized discount and deferred financing costs | | (155) | | | (160) | |
| Revolving credit facility | | 22 | | | 174 | |
| Finance lease and other financing obligations | | 504 | | | 247 | |
| Total long-term debt | | $ | 20,300 | | | $ | 21,612 | |
| | | | |
At December 31, 2020, our debt consisted primarily of $18.3 billion of fixed rate senior notes and $1.3 billion of variable rate term loan. Interest on our U.S. dollar-denominated senior notes is paid semi-annually, while interest on our Euro- and British Pound-denominated senior notes is paid annually. Interest on our revolving credit facility is paid weekly, or more frequently on occasion, and interest on our term loans is paid monthly. Our 4.75% senior notes due in June 2021 were classified in the consolidated balance sheet as long-term, as we have the intent to refinance this debt on a long-term basis and the ability to do so under our revolving credit facility, which expires in September 2023. We were in compliance with all financial debt covenants during 2020. Our ability to meet future debt covenant requirements will depend on our continued ability to generate earnings and cash flows. As described below, the COVID-19 pandemic has created significant uncertainty as to general economic and market conditions. We expect to remain in compliance with all terms and conditions associated with our outstanding debt, including financial debt covenants.
Senior Notes
We have outstanding $18.3 billion of various fixed-rate senior notes, as described above. The indentures governing our senior notes contain covenants that, among other matters, limit (i) our ability to consolidate or merge with or into, or convey, transfer or lease all or substantially all of our properties and assets to, another person, (ii) our and certain of our subsidiaries’ ability to create or assume liens, and (iii) our and certain of our subsidiaries’ ability to engage in sale and leaseback transactions. We may, at our option, redeem the senior notes, in whole or from time to time in part, at any time prior to the applicable maturity date. The interest rate applicable to certain of the senior notes is subject to an increase of up to two percent in the event that the credit rating assigned to such notes is downgraded below investment grade.
On May 13, 2020, we completed an offering of $2.0 billion of senior notes comprised of $1.0 billion aggregate principal amount of 2.25% senior notes due in June 2027 and $1.0 billion aggregate principal amount of 2.65% senior notes due in June 2030. The indentures governing the senior notes contain covenants that are substantially the same as those set forth in our senior notes described above. We used the net proceeds from these senior notes offerings to repay the outstanding principal balance of $850 million under our 2.7% senior notes due in June 2020 and outstanding borrowings under our amended and restated revolving credit facility totaling $1.1 billion.
On June 24, 2019 and July 1, 2019, we completed various offerings of senior notes for the purpose of funding the repayment of certain indebtedness of First Data and its subsidiaries on the closing date of the acquisition. Such offerings consisted of the following: | | | | | | | | | | | | | | | | | |
| | | | | |
| (In millions) | Interest Rates | | Maturities | | Aggregate Principal Amount |
| U.S. dollar denominated senior notes | 2.750% - 4.400% | | July 2024 - 2049 | | $ | 9,000 | |
| Euro denominated senior notes | 0.375% - 1.625% | | July 2023 - 2030 | | € | 1,500 | |
| British Pound denominated senior notes | 2.250% - 3.000% | | July 2025 - 2031 | | £ | 1,050 | |
| | | | | |
We used a portion of the net proceeds from the senior note offerings described above in June 2019 to repay outstanding borrowings totaling $790 million under our amended and restated revolving credit facility. On July 29, 2019, concurrent with the acquisition of First Data, we used the remaining net proceeds from the 2019 senior notes offerings described above, as well as the net proceeds of the term loan facility and a drawing on our revolving credit facility described below, to repay $16.4 billion of existing First Data debt and to pay fees and our expenses related to such repayment, the First Data acquisition and related transactions. In March 2019, we entered into treasury lock agreements (“Treasury Locks”), designated as cash flow hedges, in the aggregate notional amount of $5.0 billion to manage exposure to fluctuations in benchmark interest rates. On June 24, 2019, concurrent with the issuance of the U.S. dollar-denominated senior notes described above, the Treasury Locks were settled resulting in a payment of $183 million that will be amortized to earnings over the terms of the originally forecasted interest payments.
In June 2019, we entered into foreign exchange forward contracts to minimize foreign currency exposure to the Euro and British Pound upon settlement of the proceeds from the foreign currency-denominated senior notes, as described above. The foreign exchange forward contracts matured on July 1, 2019, concurrent with the closing of the offering of the foreign currency-denominated senior notes. We realized foreign currency transaction gains of $3 million from these foreign exchange forward contracts. In addition, we held a portion of the proceeds from the issuance of these foreign currency-denominated senior notes in Euro- and British Pound-denominated cash and cash equivalents. We realized foreign currency transaction losses of $19 million as a result of changes in the U.S. dollar equivalent of the Euro- and British Pound-denominated cash due to fluctuations in foreign currency exchange rates.
In September 2018, we completed an offering of $2.0 billion of senior notes comprised of $1.0 billion aggregate principal amount of 3.8% senior notes due in October 2023 and $1.0 billion aggregate principal amount of 4.2% senior notes due in October 2028. We used the net proceeds from such offering to repay the outstanding principal balance of $540 million under our then-existing term loan and the then-outstanding borrowings under our amended and restated revolving credit facility totaling $1.1 billion. In addition, we commenced a cash tender offer in September 2018 for any and all of our then-outstanding $450 million aggregate principal amount of 4.625% senior notes due October 2020. Upon expiration of the tender offer on September 26, 2018, $246 million was tendered. In October 2018, we retired the remaining outstanding $204 million aggregate principal amount of 4.625% senior notes. We recorded a pre-tax loss on early debt extinguishment of $14 million during the year ended December 31, 2018 related to these activities.
Term Loan Facility
On February 15, 2019, we entered into a term loan credit agreement with a syndicate of financial institutions pursuant to which such financial institutions committed to provide us with a senior unsecured term loan facility in an aggregate amount of $5.0 billion, consisting of $1.5 billion in commitments to provide loans with a term of three years and $3.5 billion in commitments to provide loans with a term of five years. On July 29, 2019, concurrent with the closing of the acquisition of First Data, the term loan credit agreement was funded. Loans drawn under the term loan facility are subject to amortization at a quarterly rate of 1.25% for the first eight quarters and 1.875% each quarter thereafter (with loans outstanding under the five-year tranche subject to amortization at a quarterly rate of 2.5% after the fourth anniversary of the commencement of amortization), with accrued and unpaid amortization amounts required to be paid on the last business day in December of each year. Borrowings under the term loan facility bear interest at variable rates based on LIBOR or on a base rate, plus in each case, a specified margin based on our long-term debt rating in effect from time to time. The variable interest rate on the term loan facility borrowings was 1.41% at December 31, 2020. The term loan credit facility contains affirmative, negative and financial covenants, and events of default, that are substantially the same as those set forth in our existing amended revolving credit facility, as described below.
Revolving Credit Facility
We maintain an amended and restated revolving credit facility, which matures in September 2023, with aggregate commitments available for $3.5 billion of total capacity. Borrowings under the amended and restated revolving credit facility bear interest at a variable rate based on LIBOR or a base rate, plus in each case a specified margin based on our long-term debt rating in effect from time to time. The variable interest rate on the revolving credit facility borrowings was 1.18% at December 31, 2020. There are no significant commitment fees and no compensating balance requirements. The amended and restated revolving credit facility contains various restrictions and covenants that require us, among other things, to (i) limit our consolidated indebtedness as of the end of each fiscal quarter to no more than three and one-half times our consolidated net earnings before interest, taxes, depreciation, amortization, non-cash charges and expenses and certain other adjustments (“EBITDA”) during the period of four fiscal quarters then ended, subject to certain exceptions, and (ii) maintain EBITDA of at least three times our consolidated interest expense as of the end of each fiscal quarter for the period of four fiscal quarters then ended.
On February 6, 2019, we entered into an amendment to our amended and restated revolving credit facility to (i) amend the maximum leverage ratio covenant to permit us to elect to increase the permitted maximum leverage ratio from three and one-half times our consolidated EBITDA to either four times or four and one-half times our consolidated EBITDA for a specified period following certain acquisitions and (ii) permit us to make drawings under the revolving credit facility on the closing date of our acquisition of First Data subject to only limited conditions. In November 2019, we elected to increase the permitted maximum leverage ratio to four times our consolidated EBITDA pursuant to the terms of the amendment described above.
Foreign Lines of Credit and Other Arrangements
We maintain certain short-term lines of credit with foreign banks and alliance partners primarily to fund settlement activity. These arrangements are primarily associated with international operations and are in various functional currencies, the most significant of which are the Australian dollar, Polish zloty, Euro and Argentine peso. We had amounts outstanding on these lines of credit totaling $144 million and $150 million at a weighted-average interest rate of 21.98% and 13.42% at December 31, 2020 and 2019, respectively.
Receivable Securitized Loan
We maintain a consolidated wholly-owned subsidiary, First Data Receivables, LLC (“FDR”). FDR is a party to certain receivables financing arrangements, including an agreement (“Receivables Financing Agreement”) with certain financial institutions and other persons from time to time party thereto as lenders and group agents, pursuant to which certain of our wholly-owned subsidiaries have agreed to transfer and contribute receivables to FDR, and FDR in turn may obtain borrowings from the financial institutions and other lender parties to the Receivables Financing Agreement secured by liens on those receivables. FDR’s assets are not available to satisfy the obligations of any other of our entities or affiliates, and FDR’s creditors would be entitled, upon its liquidation, to be satisfied out of FDR’s assets prior to any assets or value in FDR becoming available to us. FDR held $811 million and $773 million in receivables as part of the securitization program at December 31, 2020 and 2019, respectively. FDR utilized the receivables as collateral in borrowings of $425 million and $500 million as of December 31, 2020 and 2019, at an average interest rate of 1.00% and 2.61%, respectively. At December 31, 2020, the collateral capacity under the Receivables Financing Agreement was $625 million, and the maximum borrowing capacity was $500 million. The term of the Receivables Financing Agreement is through July 2022.
Other
Access to capital markets impacts our cost of capital, our ability to refinance maturing debt and our ability to fund future acquisitions. Our ability to access capital on favorable terms depends on a number of factors, including general market conditions, interest rates, credit ratings on our debt securities, perception of our potential future earnings and the market price of our common stock. As of December 31, 2020, we had a corporate credit rating of Baa2 with a stable outlook from Moody’s Investors Service, Inc. (“Moody’s”) and BBB with a stable outlook from Standard & Poor’s Ratings Services (“S&P”) on our senior unsecured debt securities.
The interest rates payable on certain of our senior notes, our term loans and our revolving credit facility are subject to adjustment from time to time if Moody’s or S&P changes the debt rating applicable to the notes. If the ratings from Moody’s or S&P decrease below investment grade, the per annum interest rates on the senior notes are subject to increase by up to two percent. In no event will the total increase in the per annum interest rates exceed two percent above the original interest rates, nor will the per annum interest rate be reduced below the original interest rate applicable to the senior notes.
Cash and Cash Equivalents
Investments (other than those included in settlement assets) with original maturities of three months or less that are readily convertible to cash are considered to be cash equivalents. At December 31, 2020 and 2019, we held $906 million and $893 million in cash and cash equivalents, respectively.
The table below details the cash and cash equivalents at December 31: | | | | | | | | | | | | | | | | | | | | | | | | | | | | | | | | | | | |
| | | | | | | | | | | |
| 2020 | | 2019 |
| (In millions) | Domestic | | International | | Total | | Domestic | | International | | Total |
| Available | $ | 337 | | | $ | 177 | | | $ | 514 | | | $ | 383 | | | $ | 208 | | | $ | 591 | |
Unavailable (1) | 57 | |
| 335 | |
| 392 | | | 130 | | | 172 | | | 302 | |
| Total | $ | 394 | | | $ | 512 | | | $ | 906 | | | $ | 513 | | | $ | 380 | | | $ | 893 | |
| | | | | | | | | | | |
(1)Represents cash held primarily by our joint ventures that is not available to fund operations outside of those entities unless the board of directors for said entities declares a dividend, as well as cash held by certain other entities that are subject to foreign exchange controls in certain countries or regulatory capital requirements.
Employee Termination Costs
In connection with the acquisition of First Data, we continue to implement integration plans focused on reducing our overall cost structure, including eliminating duplicate costs. We recorded $131 million and $32 million of employee termination costs related to severance and other separation costs for terminated employees in connection with the acquisition of First Data during the years ended December 31, 2020 and 2019, respectively. Accrued employee severance and other separation costs of $27 million at December 31, 2020 are expected to be paid within the next twelve months. We continue to evaluate operating efficiencies and anticipate incurring additional costs in connection with these activities, but are unable to estimate those amounts at this time as such plans are not yet finalized.
Impact of COVID-19 Pandemic
The COVID-19 pandemic has created significant uncertainty as to general global economic and market conditions. We believe we have adequate capital resources and sufficient access to external financing sources to satisfy our current and reasonably anticipated requirements for funds to conduct our operations and meet other needs in the ordinary course of our business. However, as the impact of the COVID-19 pandemic on the economy and our operations evolves, we will continue to assess our liquidity needs. The ability to continue to service debt and meet lease and other obligations as they come due is dependent on our continued ability to generate earnings and cash flows. A lack of continued recovery or further deterioration in economic and market conditions could materially affect our future access to our sources of liquidity, particularly our cash flows from operations.
We engage in regular communication with the banks that participate in our revolving credit facility. During these communications, none of the banks have indicated that they may be unable to perform on their commitments. We periodically review our banking and financing relationships, considering the stability of the institutions, pricing we receive on services and other aspects of the relationships. Based on these communications and our monitoring activities, we believe the likelihood of one of our banks not performing on its commitment is remote. As evidenced by our May 2020 senior notes offering described above, the long-term debt markets have historically provided us with a source of liquidity. Although we do not currently
anticipate an inability to obtain financing from long-term debt markets in the future, effects of the COVID-19 pandemic could make financing more difficult and/or expensive to obtain. Our ability to access the long-term debt markets on favorable interest rate and other terms also depends on the ratings assigned by the credit rating agencies to our indebtedness. As of December 31, 2020, we had a corporate credit rating of Baa2 with a stable outlook from Moody’s Investors Service, Inc. and BBB with a stable outlook from Standard & Poor’s Rating Services. In the event that the ratings of our outstanding long-term debt securities were substantially lowered or withdrawn for any reason, or if the ratings assigned to any new issue of long-term debt securities were significantly lower than those noted above, particularly if we no longer had investment grade ratings, our ability to access the debt markets could be adversely affected and our interest expense could increase under the terms of certain of our long-term debt securities.
Off-Balance Sheet Arrangements and Contractual Obligations
We do not participate in, nor have we created, any off-balance sheet variable interest entities or other off-balance sheet financing. The following table details our contractual obligations at December 31, 2020: | | | | | | | | | | | | | | | | | | | | | | | | | | | | | | | | |
| | | | | | | | | | |
| (In millions) | | Total | | Less than
1 year | | 1-3 years | | 3-5 years | | More than
5 years |
Long-term debt including interest (1) (2) | | $ | 25,957 | | | $ | 899 | | | $ | 4,470 | | | $ | 5,770 | | | $ | 14,818 | |
Minimum finance lease payments (1) | | 410 | | | 107 | | | 201 | | | 99 | | | 3 | |
Minimum operating lease payments (1) (3) | | 657 | | | 136 | | | 223 | | | 152 | | | 146 | |
Purchase obligations (1) | | 1,889 | | | 608 | | | 787 | | | 328 | | | 166 | |
| Income tax obligations | | 171 | | | 61 | | | 46 | | | 29 | | | 35 | |
| Total | | $ | 29,084 | | | $ | 1,811 | | | $ | 5,727 | | | $ | 6,378 | | | $ | 15,168 | |
| | | | | | | | | | |
(1)Interest, finance lease, operating lease and purchase obligations are reported on a pre-tax basis.
(2)The calculations assume that only mandatory debt repayments are made, no additional refinancing or lending occurs, except for our 4.75% notes due in June 2021 as we have the intent to refinance this debt on a long-term basis and the ability to do so under our revolving credit facility maturing in September 2023, and the variable rate on the revolving credit facility and term loans are priced at the rate in effect at December 31, 2020.
(3)Excludes $30 million of legally binding minimum lease payments for finance leases that have been signed but not yet commenced.
Item 7A. Quantitative and Qualitative Disclosures About Market Risk
Market risk refers to the risk that a change in the level of one or more market prices, interest rates, currency exchange rates, indices, correlations or other market factors, such as liquidity, will result in losses for a certain financial instrument or group of financial instruments. We are exposed to certain market risks, primarily from fluctuations in interest rates and foreign currency exchange rates. Our senior management actively monitors these risks.
Interest Rate Risk
In addition to existing cash balances and cash provided by operating activities, we use a combination of fixed- and variable-rate debt instruments to finance our operations. We are exposed to interest rate risk on certain of these debt obligations. We had fixed- and variable-rate debt, excluding finance leases and other financing obligations, with varying maturities for an aggregate carrying amount of $18.3 billion and $1.8 billion, respectively, at December 31, 2020. Our fixed-rate debt at December 31, 2020 primarily consisted of fixed-rate senior notes with a fair value of $20.7 million, based on matrix pricing which considers readily observable inputs of comparable securities. The potential change in fair value of our fixed-rate senior notes from a hypothetical 1% change in market interest rates would not alone impact any decisions to repurchase our outstanding fixed-rate debt instruments before their maturity. Our variable-rate debt at December 31, 2020 primarily consisted of outstanding borrowings on our revolving credit facility, variable rate term loan, foreign lines of credit and debt associated with the receivables securitization agreement. Based on our outstanding debt balances and interest rates at December 31, 2020, a hypothetical 1% increase in market interest rates related to our variable-rate debt would increase annual interest expense by approximately $18 million. This sensitivity analysis assumes the outstanding debt balances at December 31, 2020 and the change in market interest rates is applicable for an entire year.
In connection with processing electronic payments transactions, the funds we receive from subscribers are invested into short-term, highly liquid investments from the time we collect the funds until payments are made to the applicable recipients. Fluctuations in market interest rates affect the interest-related income that we earn on these investments. A hypothetical 1% decrease in market interest rates would decrease annual interest-related income related to settlement assets by approximately
$30 million over the next twelve months. This sensitivity analysis assumes the subscriber fund balances at December 31, 2020 and the change in market interest rates is applicable for an entire year.
Foreign Currency Risk
We conduct business globally and are exposed to foreign currency risk from changes in the value of underlying assets and liabilities of our non-U.S. dollar-denominated foreign investments and foreign currency transactions. We manage the exposure to these risks through the use of foreign currency forward exchange contracts and non-derivative net investment hedges.
Our exposure to foreign currency exchange risks generally arise from our non-U.S. operations to the extent they are conducted in local currency. Approximately 13% and 12% of our total revenue was generated outside the U.S in 2020 and 2019, respectively. The major currencies to which our revenues are exposed are the Euro, the British Pound, the Indian Rupee and the Argentine Peso. A strengthening or weakening of the U.S. dollar relative to the currencies in which our revenue and profits are denominated by 10% would have resulted in a decrease or increase , respectively, in our reported pre-tax income as follows at December 31: | | | | | | | | | | | | | | | | | | | |
| | | | | | | | | |
(In millions) | | | 2020 | | 2019 | | | | |
| Euro | | | $ | 7 | | | $ | 7 | | | | | |
| British Pound | | | 3 | | | 4 | | | | | |
| Indian Rupee | | | 2 | | | 3 | | | | | |
| Argentine Peso | | | 3 | | | 2 | | | | | |
| Other | | | 5 | | | 9 | | | | | |
| Total increase or decrease | | | $ | 20 | | | $ | 25 | | | | | |
| | | | | | | | | |
We have entered into foreign currency forward exchange contracts, which have been designated as cash flow hedges, to hedge foreign currency exposure to our operating costs in India. At December 31, 2020, the notional amount of these derivatives was approximately $259 million, with a positive fair value of $9 million. In addition, we designated our foreign currency-denominated senior notes as net investment hedges to reduce exposure to changes in the value of our net investments in certain foreign subsidiaries due to changes in foreign currency exchange rates. Refer to Item 1A in Part I of this Annual Report on Form 10-K for an additional discussion of risks and potential risks of the COVID-19 pandemic on our business.
Item 8. Financial Statements and Supplementary Data
Index to Consolidated Financial Statements
Fiserv, Inc.
Consolidated Statements of Income
| | | | | | | | | | | | | | | | | | | | |
| In millions, except per share data | | | | | | |
| Year Ended December 31, | | 2020 | | 2019 | | 2018 |
| | | | | | |
| Revenue: | | | | | | |
Processing and services (1) | | $ | 12,215 | | | $ | 8,573 | | | $ | 4,975 | |
| Product | | 2,637 | | | 1,614 | | | 848 | |
| Total revenue | | 14,852 | | | 10,187 | | | 5,823 | |
| Expenses: | | | | | | |
| Cost of processing and services | | 5,841 | | | 4,016 | | | 2,324 | |
| Cost of product | | 1,971 | | | 1,293 | | | 745 | |
| Selling, general and administrative | | 5,652 | | | 3,284 | | | 1,228 | |
| Gain on sale of businesses | | (464) | | | (15) | | | (227) | |
| Total expenses | | 13,000 | | | 8,578 | | | 4,070 | |
| Operating income | | 1,852 | | | 1,609 | | | 1,753 | |
| Interest expense, net | | (709) | | | (473) | | | (189) | |
| Debt financing activities | | — | | | (47) | | | (14) | |
| Other income (expense) | | 28 | | | (6) | | | 5 | |
| Income before income taxes and income from investments in unconsolidated affiliates | | 1,171 | | | 1,083 | | | 1,555 | |
| Income tax provision | | (196) | | | (198) | | | (378) | |
| Income from investments in unconsolidated affiliates | | — | | | 29 | | | 10 | |
| | | | | | |
| | | | | | |
| Net income | | 975 | | | 914 | | | 1,187 | |
| Less: net income attributable to noncontrolling interests and redeemable noncontrolling interests | | 17 | | | 21 | | | — | |
| Net income attributable to Fiserv, Inc. | | $ | 958 | | | $ | 893 | | | $ | 1,187 | |
| | | | | | |
| | | | | | |
| Net income attributable to Fiserv, Inc. per share – basic | | $ | 1.42 | | | $ | 1.74 | | | $ | 2.93 | |
| | | | | | |
| | | | | | |
| | | | | | |
| Net income attributable to Fiserv, Inc. per share – diluted | | $ | 1.40 | | | $ | 1.71 | | | $ | 2.87 | |
| | | | | | |
| | | | | | |
| | | | | | |
| Shares used in computing net income attributable to Fiserv, Inc. per share: | | | | | | |
| Basic | | 672.1 | | | 512.3 | | | 405.5 | |
| Diluted | | 683.4 | | | 522.6 | | | 413.7 | |
| | | | | | |
(1)Includes processing and other fees charged to related party investments accounted for under the equity method of $236 million, $112 million and $28 million for the years ended December 31, 2020, 2019 and 2018, respectively (see Notes 9 and 20).
Fiserv, Inc.
Consolidated Statements of Comprehensive Income
| | | | | | | | | | | | | | | | | | | | |
| In millions | | | | | | |
| Year Ended December 31, | | 2020 | | 2019 | | 2018 |
| | | | | | |
| Net income | | $ | 975 | | | $ | 914 | | | $ | 1,187 | |
| Other comprehensive (loss) income: | | | | | | |
Fair market value adjustment on cash flow hedges, net of income tax (provision) benefit of ($2 million), $46 million and $2 million | | 5 | | | (134) | | | (5) | |
Reclassification adjustment for net realized gains on cash flow hedges included in cost of processing and services, net of income tax benefit of $0 million, $0 million and $0 million | | (1) | | | (1) | | | (1) | |
Reclassification adjustment for net realized losses on cash flow hedges included in net interest expense, net of income tax provision of $5 million, $3 million and $2 million | | 16 | | | 10 | | | 4 | |
Unrealized losses on defined benefit pension plans, net of income tax benefit of $2 million and $1 million | | (6) | | | (4) | | | — | |
| Foreign currency translation | | (186) | | | 8 | | | (11) | |
| Total other comprehensive loss | | (172) | | | (121) | | | (13) | |
| Comprehensive income | | $ | 803 | | | $ | 793 | | | $ | 1,174 | |
| Less: net income attributable to noncontrolling interests and redeemable noncontrolling interests | | 17 | | | 21 | | | — | |
| Less: other comprehensive income (loss) attributable to noncontrolling interests | | 35 | | | (8) | | | — | |
| Comprehensive income attributable to Fiserv, Inc. | | $ | 751 | | | $ | 780 | | | $ | 1,174 | |
See accompanying notes to consolidated financial statements.
53
Fiserv, Inc.
Consolidated Balance Sheets
| | | | | | | | | | | | | | |
| In millions | | | | |
| December 31, | | 2020 | | 2019 |
| | | | |
| Assets | | | | |
| Cash and cash equivalents | | $ | 906 | | | $ | 893 | |
| Trade accounts receivable, less allowance for doubtful accounts | | 2,482 | | | 2,782 | |
| Prepaid expenses and other current assets | | 1,310 | | | 1,503 | |
| Settlement assets | | 11,521 | | | 11,868 | |
| Total current assets | | 16,219 | | | 17,046 | |
| Property and equipment, net | | 1,628 | | | 1,606 | |
| Customer relationships, net | | 11,603 | | | 14,042 | |
| Other intangible assets, net | | 3,755 | | | 3,600 | |
| Goodwill | | 36,322 | | | 36,038 | |
| Contract costs, net | | 692 | | | 533 | |
| Investments in unconsolidated affiliates | | 2,756 | | | 2,720 | |
| Other long-term assets | | 1,644 | | | 1,954 | |
| Total assets | | $ | 74,619 | | | $ | 77,539 | |
| Liabilities and Equity | | | | |
| Accounts payable and accrued expenses | | $ | 3,186 | | | $ | 3,080 | |
| Short-term and current maturities of long-term debt | | 384 | | | 287 | |
| Contract liabilities | | 546 | | | 492 | |
| Settlement obligations | | 11,521 | | | 11,868 | |
| Total current liabilities | | 15,637 | | | 15,727 | |
| Long-term debt | | 20,300 | | | 21,612 | |
| Deferred income taxes | | 4,389 | | | 4,247 | |
| Long-term contract liabilities | | 187 | | | 155 | |
| Other long-term liabilities | | 777 | | | 941 | |
| Total liabilities | | 41,290 | | | 42,682 | |
| Commitments and Contingencies (see Note 19) | | | | |
| Redeemable Noncontrolling Interests | | 259 | | | 262 | |
| Fiserv, Inc. Shareholders’ Equity: | | | | |
Preferred stock, no par value: 25.0 million shares authorized; none issued | | — | | | — | |
Common stock, $0.01 par value: 1,800.0 million shares authorized; 789.6 million shares issued | | 8 | | | 8 | |
| Additional paid-in capital | | 23,643 | | | 23,741 | |
| Accumulated other comprehensive loss | | (387) | | | (180) | |
| Retained earnings | | 13,441 | | | 12,528 | |
Treasury stock, at cost, 120.5 million and 111.5 million shares | | (4,375) | | | (3,118) | |
| Total Fiserv, Inc. shareholders’ equity | | 32,330 | | | 32,979 | |
| Noncontrolling interests | | 740 | | | 1,616 | |
| Total equity | | 33,070 | | | 34,595 | |
| Total liabilities and equity | | $ | 74,619 | | | $ | 77,539 | |
See accompanying notes to consolidated financial statements.
54
Fiserv, Inc.
Consolidated Statements of Equity
| | | | | | | | | | | | | | | | | | | | | | | | | | | | | | | | |
| Fiserv, Inc. Shareholders’ Equity | | |
| | | | | | | | | |
| | Number of Shares | | Amount |
| In millions | Common Shares | Treasury Shares | | Common Stock | Additional
Paid-In
Capital | Accumulated
Other
Comprehensive
Loss | Retained
Earnings | Treasury Stock | Noncontrolling Interests | Total Equity |
| | | | | | | | | | |
| Balance at January 1, 2018 | 791 | | 376 | | | $ | 8 | | $ | 1,031 | | $ | (54) | | $ | 10,240 | | $ | (8,494) | | $ | — | | $ | 2,731 | |
| Net income | | | | | | | 1,187 | | | | 1,187 | |
| Other comprehensive loss | | | | | | (13) | | | | | (13) | |
| Share-based compensation | | | | | 73 | | | | | | 73 | |
| Shares issued under stock plans | | (3) | | | | (47) | | | | 69 | | | 22 | |
| Purchases of treasury stock | | 26 | | | | | | | (1,915) | | | (1,915) | |
| Cumulative-effect adjustment of ASU 2014-09 adoption | | | | | | | 208 | | | | 208 | |
| Cumulative-effect adjustment of ASU 2017-12 adoption | | | | | | 3 | | (3) | | | | — | |
| Cumulative-effect adjustment of ASU 2018-02 adoption | | | | | | (3) | | 3 | | | | — | |
| Balance at December 31, 2018 | 791 | | 399 | | | 8 | | 1,057 | | (67) | | 11,635 | | (10,340) | | — | | 2,293 | |
Net income (1) | | | | | | | 893 | | | 4 | | 897 | |
| Shares issued to acquire First Data (see Note 4) | | (286) | | | | 22,582 | | | | 7,478 | | 1,731 | | 31,791 | |
Distributions paid to noncontrolling interests (2) | | | | | | | | | (111) | | (111) | |
| Other comprehensive loss | | | | | | (113) | | | | (8) | | (121) | |
| Share-based compensation | | | | | 229 | | | | | | 229 | |
| Shares issued under stock plans | | (5) | | | | (127) | | | | 137 | | | 10 | |
| Purchases of treasury stock | | 4 | | | | | | | (393) | | | (393) | |
| | | | | | | | | | |
| | | | | | | | | | |
| | | | | | | | | | |
| Balance at December 31, 2019 | 791 | | 112 | | | 8 | | 23,741 | | (180) | | 12,528 | | (3,118) | | 1,616 | | 34,595 | |
Net income (loss) (1) | | | | | | | 958 | | | (22) | | 936 | |
| Measurement period adjustments related to First Data acquisition (see Note 4) | | | | | | | | | (126) | | (126) | |
Distributions paid to noncontrolling interests (2) | | | | | | | | | (37) | | (37) | |
| Net adjustment to noncontrolling interests from dissolution (see Note 4) | | | | | (36) | | | | | (726) | | (762) | |
| Other comprehensive (loss) income | | | | | | (207) | | | | 35 | | (172) | |
| Share-based compensation | | | | | 369 | | | | | | 369 | |
| Shares issued under stock plans | | (5) | | | | (231) | | | | 178 | | | (53) | |
| Purchases of treasury stock | | 16 | | | | | | | (1,635) | | | (1,635) | |
| Retirement of treasury stock (see Note 20) | (2) | | (2) | | | | (200) | | | | 200 | | | — | |
Cumulative-effect adjustment of ASU 2016-13 adoption | | | | | | | (45) | | | | (45) | |
| Balance at December 31, 2020 | 789 | | 121 | | | $ | 8 | | $ | 23,643 | | $ | (387) | | $ | 13,441 | | $ | (4,375) | | $ | 740 | | $ | 33,070 | |
| | | | | | | | | | |
| | | | | | | | | | |
(1)The total net income presented in the consolidated statements of equity for the years ended December 31, 2020 and 2019 is different than the amount presented in the consolidated statements of income due to the net income attributable to redeemable noncontrolling interests of $39 million and $17 million, respectively, not included in equity.
(2)The total distributions presented in the consolidated statements of equity for the years ended December 31, 2020 and 2019 exclude $42 million and $7 million, respectively, in distributions paid to redeemable noncontrolling interests not included in equity. In addition, the total distributions presented in the consolidated statements of equity for the year ended December 31, 2020 exclude $25 million in distributions to Bank of America related to the Banc of America Merchant Services Joint Venture (see Note 4) not included in equity.
See accompanying notes to consolidated financial statements.
55
Fiserv, Inc.
Consolidated Statements of Cash Flows
| | | | | | | | | | | | | | | | | | | | |
| In millions | | | | | | |
| Year Ended December 31, | | 2020 | | 2019 | | 2018 |
| | | | | | |
| Cash flows from operating activities: | | | | | | |
| Net income | | $ | 975 | | | $ | 914 | | | $ | 1,187 | |
| | | | | | |
Adjustments to reconcile net income to net cash provided by operating activities from continuing operations: | | | | | | |
| Depreciation and other amortization | | 1,077 | | | 615 | | | 382 | |
| Amortization of acquisition-related intangible assets | | 2,133 | | | 1,036 | | | 163 | |
| Amortization of financing costs, debt discounts and other | | 47 | | | 127 | | | 11 | |
| Net foreign currency gain on financing activities | | — | | | (50) | | | — | |
| Share-based compensation | | 369 | | | 229 | | | 73 | |
| | | | | | |
| Deferred income taxes | | 71 | | | 47 | | | 133 | |
| Gain on sale of businesses | | (464) | | | (15) | | | (227) | |
| Income from investments in unconsolidated affiliates | | — | | | (29) | | | (10) | |
| Distributions from unconsolidated affiliates | | 42 | | | 23 | | | 2 | |
| Settlement of interest rate hedge contracts | | — | | | (183) | | | — | |
| Non-cash impairment charges | | 124 | | | 48 | | | 3 | |
| | | | | | |
| Other operating activities | | (16) | | | (3) | | | 4 | |
| Changes in assets and liabilities, net of effects from acquisitions and dispositions: | | | | | | |
| Trade accounts receivable | | 320 | | | (7) | | | (108) | |
| Prepaid expenses and other assets | | (167) | | | (82) | | | (6) | |
| Contract costs | | (289) | | | (212) | | | (137) | |
| Accounts payable and other liabilities | | (146) | | | 238 | | | 116 | |
| Contract liabilities | | 71 | | | 99 | | | (34) | |
| Net cash provided by operating activities from continuing operations | | 4,147 | | | 2,795 | | | 1,552 | |
| Cash flows from investing activities: | | | | | | |
| Capital expenditures, including capitalized software and other intangibles | | (900) | | | (721) | | | (360) | |
| Proceeds from sale of businesses | | 579 | | | 51 | | | 419 | |
| Payments for acquisitions of businesses, net of cash acquired and including working capital adjustments | | (139) | | | (16,005) | | | (712) | |
| Distributions from unconsolidated affiliates | | 109 | | | 113 | | | — | |
| Purchases of investments | | (1) | | | (45) | | | (3) | |
| Other investing activities | | 11 | | | 5 | | | (7) | |
| Net cash used in investing activities from continuing operations | | (341) | | | (16,602) | | | (663) | |
| Cash flows from financing activities: | | | | | | |
| Debt proceeds | | 8,897 | | | 20,030 | | | 5,039 | |
| Debt repayments | | (10,918) | | | (5,043) | | | (4,005) | |
| Short-term borrowings, net | | (6) | | | — | | | — | |
| Payments of debt financing, redemption and other costs | | (16) | | | (247) | | | — | |
| Proceeds from issuance of treasury stock | | 133 | | | 156 | | | 75 | |
| Purchases of treasury stock, including employee shares withheld for tax obligations | | (1,826) | | | (561) | | | (1,946) | |
| | | | | | |
| Distributions paid to noncontrolling interests and redeemable noncontrolling interests | | (104) | | | (118) | | | — | |
| Other financing activities | | 4 | | | (26) | | | (5) | |
| Net cash (used in) provided by financing activities from continuing operations | | (3,836) | | | 14,191 | | | (842) | |
| Effect of exchange rate changes on cash, cash equivalents and restricted cash | | 16 | | | 1 | | | — | |
| Net change in cash, cash equivalents and restricted cash from continuing operations | | (14) | | | 385 | | | 47 | |
| Net cash flows from discontinued operations | | — | | | 133 | | | 43 | |
| Cash, cash equivalents and restricted cash, beginning balance | | 933 | | | 415 | | | 325 | |
| Cash, cash equivalents and restricted cash, ending balance | | $ | 919 | | | $ | 933 | | | $ | 415 | |
| Discontinued operations cash flow information: | | | | | | |
| Net cash used in operating activities | | $ | — | | | $ | — | | | $ | (7) | |
| Net cash provided by investing activities | | — | | | 133 | | | 50 | |
| Net change in cash, cash equivalents and restricted cash from discontinued operations | | $ | — | | | $ | 133 | | | $ | 43 | |
See accompanying notes to consolidated financial statements.
56
Fiserv, Inc.
Notes to Consolidated Financial Statements
1. Summary of Significant Accounting Policies
Description of the Business
Fiserv, Inc. and its subsidiaries (collectively, the “Company”) provide payments and financial services technology solutions to clients worldwide. The Company provides account processing and digital banking solutions; card issuer processing and network services; payments; e-commerce; merchant acquiring and processing; and the Clover® cloud-based point-of-sale solution. The Company serves clients around the globe, including banks, credit unions, other financial institutions and merchants.
On July 29, 2019, the Company acquired First Data Corporation (“First Data”) by acquiring 100% of the First Data stock that was issued and outstanding as of the date of acquisition for a total purchase price of $46.5 billion (see Note 4). First Data provides a wide-range of solutions to merchants, including retail point-of-sale merchant transaction processing and acquiring, e-commerce services, mobile payment services and the cloud-based Clover point-of-sale operating system, as well as technology solutions for bank and non-bank issuers. The consolidated financial statements include the financial results of First Data from the date of acquisition.
Effective in the first quarter of 2020, the Company realigned its reportable segments to reflect its new management structure and organizational responsibilities (“Segment Realignment”) following the acquisition of First Data. The Company’s reportable segments are Merchant Acceptance (“Acceptance”), Financial Technology (“Fintech”) and Payments and Network (“Payments”). Segment results for the years ended December 31, 2019 and 2018 have been restated to reflect the Segment Realignment. Additional information regarding the Company’s business segments is included in Note 21 to the consolidated financial statements.
Principles of Consolidation
The consolidated financial statements include the accounts of Fiserv, Inc. and its subsidiaries in which the Company holds a controlling financial interest. Control is normally established when ownership and voting interests in an entity are greater than 50%. Investments in which the Company has significant influence but not control are accounted for using the equity method of accounting, for which the Company’s share of net income or loss is reported within income from investments in unconsolidated affiliates and the related tax expense or benefit is reported within the income tax provision in the consolidated statements of income. Significant influence over an affiliate’s operations generally coincides with an ownership interest in an entity of between 20% and 50%. All intercompany transactions and balances have been eliminated in consolidation.
The Company maintains majority controlling interests in certain entities, mostly related to consolidated merchant alliances (see Note 20). Noncontrolling interests represent the minority shareholders’ share of the net income or loss and equity in consolidated subsidiaries. The Company’s noncontrolling interests presented in the consolidated statements of income include net income attributable to noncontrolling interests and redeemable noncontrolling interests. Noncontrolling interests are presented as a component of equity in the consolidated balance sheets and reflect the minority shareholders’ share of acquired fair value in the consolidated subsidiaries, along with their proportionate share of the earnings or losses of the subsidiaries, net of dividends or distributions. Noncontrolling interests that are redeemable upon the occurrence of an event that is not solely within the Company’s control are presented outside of equity and are carried at their estimated redemption value if it exceeds the initial carrying value of the redeemable interest (see Note 13).
Stock Split
On February 21, 2018, the Company’s board of directors declared a two-for-one stock split of the Company’s common stock and a proportionate increase in the number of its authorized shares of common stock. The additional shares were distributed on March 19, 2018 to shareholders of record at the close of business on March 5, 2018. The Company’s common stock began trading at the split-adjusted price on March 20, 2018. The impact on the consolidated balance sheet of the stock split was an increase of $4 million to common stock and an offsetting reduction in additional paid-in capital.
Use of Estimates
The preparation of financial statements in conformity with accounting principles generally accepted in the United States requires management to make estimates and assumptions that affect the reported amounts of assets and liabilities and disclosure of contingent assets and liabilities at the date of the financial statements and the reported amounts of revenue and expenses during the reporting period. Actual results could differ materially from those estimates.
See accompanying notes to consolidated financial statements.
57
Risks and Uncertainties
In 2019, a novel strain of coronavirus (“COVID-19”) was identified and has since continued to spread. In March 2020, the World Health Organization recognized the COVID-19 outbreak as a pandemic. In response to the COVID-19 pandemic, the governments of many countries, states, cities and other geographic regions have taken actions to prevent the spread of COVID-19, such as imposing travel restrictions and bans, quarantines, social distancing guidelines, shelter-in-place or lock-down orders and other similar limitations, adversely impacting global economic activity and contributing to significant volatility in financial markets.
Global economic and market conditions impact levels of consumer and business spending, which have been negatively impacted as a result of the COVID-19 pandemic. Consequently, the Company’s operating performance, primarily within its merchant acquiring and payment-related businesses, which earn transaction-based fees, has been adversely affected, and may continue to be adversely affected, by the economic impact of the COVID-19 pandemic. The extent of the impact of the COVID-19 pandemic on the Company’s future operational and financial performance will depend on, among other matters, the duration and intensity of the pandemic; the level of success of global vaccination efforts; governmental and private sector responses to the pandemic and the impact of such responses on the Company; and the impact of the pandemic on the Company’s employees, clients, vendors, operations and sales, all of which are uncertain and cannot be predicted. These changing conditions may also affect the estimates and assumptions made by management. Such estimates and assumptions affect, among other things, the valuations of the Company’s long-lived assets, definite-lived intangible assets and equity method investments; the impairment assessment of goodwill; the Company’s deferred tax assets and related valuation allowances; the estimate of current expected credit losses; and certain pension plan assumptions. Changes in any assumptions used may result in an impairment or other charge that, if incurred, could have a material adverse impact on the Company’s results of operations, total assets and total equity in the period recognized. Events and changes in circumstances arising subsequent to December 31, 2020, including those resulting from the impacts of the COVID-19 pandemic, will be reflected in management’s estimates for future periods.
Revenue Recognition
The Company generates revenue from the delivery of processing, service and product solutions. Revenue is measured based on consideration specified in a contract with a customer, and excludes any amounts collected on behalf of third parties. The Company recognizes revenue when it satisfies a performance obligation by transferring control over a product or service to a customer which may be at a point in time or over time. Additional information regarding the Company’s revenue recognition policies is included in Note 3 to the consolidated financial statements.
Cash and Cash Equivalents
Cash and cash equivalents consist of cash and investments with original maturities of 90 days or less. Cash and cash equivalents are stated at cost in the consolidated balance sheets, which approximates market value. Cash and cash equivalents that were restricted from use due to regulatory or other requirements are included in other long-term assets in the consolidated balance sheets and totaled $13 million and $40 million at December 31, 2020 and 2019, respectively.
Allowance for Doubtful Accounts
The Company analyzes the collectability of trade accounts receivable by considering historical bad debts, client creditworthiness, current economic trends, changes in client payment terms and collection trends when evaluating the adequacy of the allowance for doubtful accounts. Any change in the assumptions used in analyzing a specific account receivable may result in an additional allowance for doubtful accounts being recognized in the period in which the change occurs. The allowance for doubtful accounts was $48 million and $39 million at December 31, 2020 and 2019, respectively.
Leases
Effective January 1, 2019, the Company adopted Accounting Standards Update (“ASU”) No. 2016-02, Leases (Topic 842) (“ASU 2016-02”), and its related amendments using the optional transition method applied to all leases. Prior period amounts have not been restated. Additional information about the Company’s lease policies and the related impact of the adoption is included in Notes 2 and 11 to the consolidated financial statements.
The Company maintains certain leasing receivables associated with its point-of-sale terminal leasing businesses. Leasing receivables are included in prepaid expenses and other current assets and other long-term assets in the consolidated balance sheets. Interest income on the Company’s leasing receivables is recognized using the effective interest method, and is included within product revenue in the consolidated statements of income. Initial direct costs are expensed as incurred if the fair value of the underlying asset is different from its carrying amount at the commencement date of the lease.
Prepaid Expenses
Prepaid expenses represent advance payments for goods and services to be consumed in the future, such as maintenance, postage and insurance and totaled $348 million at both December 31, 2020 and 2019.
Settlement Assets and Obligations
Settlement assets and obligations result from timing differences between collection and fulfillment of payment transactions primarily associated with the Company’s merchant acquiring services. Settlement assets represent cash received or amounts receivable from agents, payment networks, bank partners or directly from consumers. Settlement obligations represent amounts payable to merchants and payees. Certain merchant settlement assets that relate to settlement obligations are held by partner banks to which the Company does not have legal ownership but has the right to use the assets to satisfy the related settlement obligations. The Company records corresponding settlement obligations for amounts payable to merchants and for payment instruments not yet presented for settlement. Additional information regarding the Company’s settlement assets and obligations is included in Note 6 to the consolidated financial statements.
Reserve for Merchant Credit Losses
With respect to the Company’s merchant acquiring business, the Company’s merchant customers have the legal obligation to refund any charges properly reversed by the cardholder. However, in the event the Company is not able to collect the refunded amounts from the merchants, the Company may be liable for the reversed charges. The Company’s risk in this area primarily relates to situations where the cardholder has purchased goods or services to be delivered in the future. The Company requires cash deposits, guarantees, letters of credit or other types of collateral from certain merchants to minimize this obligation. Collateral held by the Company is classified within settlement assets and the obligation to repay the collateral is classified within settlement obligations on the Company’s consolidated balance sheets. The Company also utilizes a number of systems and procedures to manage merchant risk. Despite these efforts, the Company experiences some level of losses due to merchant defaults.
The aggregate merchant credit losses incurred by the Company was $113 million and $40 million for the years ended December 31, 2020 and 2019, respectively, included within cost of processing and services in the consolidated statements of income. The amount of collateral held by the Company was $1.2 billion and $510 million at December 31, 2020 and 2019, respectively. The Company maintains a reserve for merchant credit losses that are expected to exceed the amount of collateral held. The reserve includes an estimated amount for anticipated chargebacks and fraud events that have been incurred on merchants’ payment transactions that have been processed but not yet reported to the Company (“IBNR Reserve”), as well as an allowance on refunded amounts to cardholders that have not yet been collected from the merchants. The IBNR Reserve, which is recorded within accounts payable and accrued expenses in the consolidated balance sheets, is based primarily on the Company’s historical experience of credit losses and other relevant factors such as economic downturns or increases in merchant fraud. The aggregate merchant credit loss reserve was $59 million and $34 million at December 31, 2020 and 2019, respectively.
Property and Equipment
Property and equipment is reported at cost. Depreciation of property and equipment is computed primarily using the straight-line method over the shorter of the estimated useful life of the asset or the leasehold period, if applicable. Property and equipment consisted of the following at December 31: | | | | | | | | | | | | | | | | | |
| | | | | |
| (In millions) | Estimated
Useful Lives | | 2020 | | 2019 |
| Land | — | | $ | 54 | | | $ | 61 | |
| Data processing equipment | 3 to 5 years | | 1,666 | | | 1,483 | |
| Buildings and leasehold improvements | 5 to 40 years | | 555 | | | 540 | |
| Furniture and equipment | 5 to 8 years | | 636 | | | 576 | |
| | | 2,911 | | | 2,660 | |
| Less: Accumulated depreciation | | | (1,283) | | | (1,054) | |
| Total | | | $ | 1,628 | | | $ | 1,606 | |
| | | | | |
Depreciation expense for all property and equipment totaled $523 million, $247 million and $92 million in 2020, 2019 and 2018, respectively (see Note 17 for a description of accelerated depreciation under certain finance lease agreements).
Intangible Assets
Customer related intangible assets represent customer contracts and relationships obtained as part of acquired businesses and are amortized using an accelerated amortization method which corresponds with the customer attrition rates used in the initial valuation of the intangibles over their estimated useful lives, generally ten to twenty years. Acquired software and technology represents software and technology intangible assets obtained as part of acquired businesses and is amortized using the straight-line method over their estimated useful lives, generally four to ten years. Trade names are amortized using the straight-line method over their estimated useful lives, generally eight to twenty years.
The Company continually develops, maintains and enhances its products and systems. Product development expenditures represented approximately 6% of the Company’s total revenue in 2020 and 8% in both 2019 and 2018. Research and development costs incurred prior to the establishment of technological feasibility are expensed as incurred. Routine maintenance of software products, design costs and other development costs incurred prior to the establishment of a product’s technological feasibility are also expensed as incurred. Costs are capitalized commencing when the technological feasibility of the software has been established.
Purchased software represents software licenses purchased from third parties and is amortized using the straight-line method over their estimated useful lives, generally three to five years. Additional information regarding the Company’s identifiable intangible assets is included in Note 7 to the consolidated financial statements.
Capitalized software development costs represent the capitalization of certain costs incurred to develop new software or to enhance existing software which is marketed externally or utilized by the Company to process client transactions. Capitalized software development costs are amortized using the straight-line method over their estimated useful lives, generally five years.
The Company may, at its discretion, negotiate to pay an independent sales organization (“ISO”) an agreed-upon up-front amount in exchange for the ISO’s surrender of its right to receive commission payments from the Company related to future transactions of the ISO’s referred merchants (“residual buyout”). The amount that the Company pays for these residual buyouts is capitalized and subsequently amortized using the straight-line method over the expected life of the merchant portfolios, generally six years to nine years.
Goodwill
Goodwill represents the excess of purchase price over the fair value of identifiable assets acquired and liabilities assumed in a business combination. The Company evaluates goodwill for impairment on an annual basis, or more frequently if circumstances indicate possible impairment. Goodwill is tested for impairment at a reporting unit level, which is one level below our reportable segments. When assessing goodwill for impairment, the Company considers (i) the prior year’s amount of excess fair value over the carrying value of each reporting unit, (ii) the period of time since a reporting unit’s last quantitative test, (iii) the extent a reorganization or disposition changes the composition of one or more of the reporting units and (iv) other factors to determine whether or not to first perform a qualitative test. When performing a qualitative test, the Company assesses numerous factors to determine whether it is more likely than not that the fair value of its reporting units are less than their respective carrying values. Examples of qualitative factors that the Company assesses include its share price, its financial performance, market and competitive factors in its industry and other events specific to its reporting units. If the Company concludes that it is more likely than not that the fair value of a reporting unit is less than its carrying value, the Company performs a quantitative impairment test by comparing reporting unit carrying values to estimated fair values.
In connection with the Segment Realignment described above, certain of the Company’s reporting units changed in composition as a result of which goodwill was allocated to such reporting units using a relative fair value approach. Accordingly, the Company performed an interim goodwill impairment assessment in the first quarter of 2020 for those reporting units impacted by the Segment Realignment and determined that its goodwill was not impaired based on an assessment of various qualitative factors, as described above. The Company’s most recent annual impairment assessment of its reporting units in the fourth quarter of 2020 determined that its goodwill was not impaired as the estimated fair values exceeded the carrying values. However, it is reasonably possible that future developments related to the economic impact of the COVID-19 pandemic on certain of the Company’s recently acquired (recorded at fair value) First Data businesses, such as an increased duration and intensity of the pandemic and/or government-imposed shutdowns, prolonged economic downturn or recession, or lack of governmental support for recovery, could have a future material impact on one or more of the estimates and assumptions used to evaluate goodwill impairment. There is no accumulated goodwill impairment for the Company through December 31, 2020. Additional information regarding the Company’s goodwill is included in Note 8 to the consolidated financial statements.
Asset Impairment
The Company reviews property and equipment, lease right-of-use (“ROU”) assets, intangible assets and its investments in unconsolidated affiliates for impairment whenever events or changes in circumstances indicate that the carrying amount of the asset may not be recoverable. The Company reviews capitalized software development costs for impairment at each reporting date. Recoverability of property and equipment, ROU assets, capitalized software development costs and other intangible assets is assessed by comparing the carrying amount of the asset to either the undiscounted future cash flows expected to be generated by the asset or the net realizable value of the asset, depending on the type of asset. The Company assesses lease ROU assets that are exited in advance of the non-cancellable lease terms by comparing the carrying values of the ROU assets to the discounted cash flows from estimated sublease payments. The Company’s investments in unconsolidated affiliates are assessed by comparing the carrying amount of the investments to their estimated fair values and are impaired if any decline in fair value is determined to be other than temporary. Measurement of any impairment loss is based on estimated fair value.
Fair Value Measurements
The Company applies fair value accounting for all assets and liabilities that are recognized or disclosed at fair value in its consolidated financial statements on a recurring basis. Fair value represents the amount that would be received from selling an asset or paid to transfer a liability in an orderly transaction between market participants at the measurement date. When determining the fair value measurements for assets and liabilities, the Company uses the hierarchy prescribed in Accounting Standards Codification (“ASC”) 820, Fair Value Measurements, and considers the principal or most advantageous market and the market-based risk measurements or assumptions that market participants would use in pricing the asset or liability. The three levels in the hierarchy are as follows:
•Level 1 – Quoted prices (unadjusted) for identical assets or liabilities in active markets that are accessible as of the
measurement date.
•Level 2 – Inputs other than quoted prices within Level 1 that are observable either directly or indirectly, including but
not limited to quoted prices in markets that are not active, quoted prices in active markets for similar assets or
liabilities and observable inputs other than quoted prices such as interest rates or yield curves.
•Level 3 – Unobservable inputs reflecting management’s judgments about the assumptions that market
participants would use in pricing the asset or liability, including assumptions about risk.
Additional information regarding the Company’s fair value measurements is included in Note 10 to the consolidated financial statements.
Accounts Payable and Accrued Expenses
Accounts payable and accrued expenses consisted of the following at December 31: | | | | | | | | | | | | | | |
| | | | |
| (In millions) | | 2020 | | 2019 |
| Trade accounts payable | | $ | 437 | | | $ | 392 | |
| Client deposits | | 702 | | | 650 | |
| Accrued compensation and benefits | | 419 | | | 378 | |
| Accrued taxes | | 130 | | | 137 | |
| Accrued interest | | 220 | | | 224 | |
| Other accrued expenses | | 1,278 | | | 1,299 | |
| Total | | $ | 3,186 | | | $ | 3,080 | |
| | | | |
Foreign Currency The United States (“U.S.”) dollar is the functional currency of the Company’s U.S.-based businesses and certain foreign-based businesses. Where the functional currency differs from the U.S. dollar, assets and liabilities are translated into U.S. dollars at the exchange rates in effect at the balance sheet date. Revenue and expenses are translated at the average exchange rates during the reporting period. Gains and losses from foreign currency translation are recorded as a separate component of accumulated other comprehensive loss. Gains and losses from foreign currency transactions are included in determining net income for the reporting period.
The Company has designated its Euro- and British Pound- denominated senior notes as net investment hedges to hedge a portion of its net investment in certain subsidiaries whose functional currencies are the Euro and the British Pound (see Note
14). Accordingly, foreign currency transaction gains or losses on the qualifying net investment hedge instruments are recorded as foreign currency translation within other comprehensive (loss) income in the consolidated statements of comprehensive income and will remain in accumulated other comprehensive loss on the consolidated balance sheet until the sale or complete liquidation of the underlying foreign subsidiaries.
Derivatives
Derivatives are entered into for periods consistent with related underlying exposures and are recorded in the consolidated balance sheets as either an asset or liability measured at fair value. If the derivative is designated as a cash flow hedge, changes in the fair value of the derivative are recorded as a component of accumulated other comprehensive loss and recognized in the consolidated statements of income when the hedged item affects earnings. The Company’s policy is to enter into derivatives with creditworthy institutions and not to enter into such derivatives for speculative purposes.
Employee Benefit Plans
The Company maintains frozen defined benefit pension plans covering certain employees in Europe and the U.S. The Company recognizes actuarial gains/losses and prior service cost in the consolidated balance sheets and recognizes changes in these amounts during the year in which changes occur through other comprehensive (loss) income. The Company uses various assumptions when computing amounts relating to its defined benefit pension plan obligations and their associated expenses (including the discount rate and the expected rate of return on plan assets). Additional information regarding the Company’s employee benefit plans is included in Note 15 to the consolidated financial statements.
Cost of Processing, Services and Product
Cost of processing and services consists of costs directly associated with providing services to clients and includes the following: personnel; equipment and data communication; infrastructure costs, including costs to maintain software applications; client support; certain depreciation and amortization; and other operating expenses.
Cost of product consists of costs directly associated with the products sold and includes the following: costs of materials and software development; personnel; infrastructure costs; certain depreciation and amortization; and other costs directly associated with product revenue.
Selling, General and Administrative Expenses
Selling, general and administrative expenses primarily consist of: salaries, wages, commissions and related expenses paid to sales personnel, administrative employees and management; advertising and promotional costs; certain depreciation and amortization; and other selling and administrative expenses.
Interest Expense, Net
Interest expense, net consists of interest expense primarily associated with the Company’s outstanding borrowings and finance lease obligations, as well as interest income primarily associated with the Company’s investment securities. The Company recognized $716 million, $507 million and $193 million of interest expense and $7 million, $34 million and $4 million of interest income during the years ended December 31, 2020, 2019 and 2018, respectively.
Income Taxes
Deferred tax assets and liabilities are recognized for the expected future tax consequences attributable to differences between financial statement carrying amounts of existing assets and liabilities and their respective tax basis, and net operating loss and tax credit carry-forwards. Deferred tax assets and liabilities are measured using enacted tax rates expected to apply to taxable income in the years in which those temporary differences are expected to be recovered or settled. A valuation allowance is recorded against deferred tax assets if it is more likely than not that some portion or all of the deferred tax assets will not be realized.
Liabilities are established for unrecognized tax benefits, attributable to differences between a tax position taken or expected to be taken in a tax return and the benefit recognized in the financial statements. In establishing a liability for an unrecognized tax benefit, assumptions are made in determining whether, and the extent to which, a tax position will be sustained. A tax position is recognized only when it is more likely than not to be sustained upon examination by the relevant taxing authority, based on its technical merits. The amount of tax benefit recognized reflects the largest benefit the Company believes is more likely than not to be realized upon ultimate settlement. As additional information becomes available, the liability for unrecognized tax benefits is reevaluated and adjusted, as appropriate. Tax benefits ultimately realized can differ from amounts previously recognized due to uncertainties, with any such differences generally impacting the provision for income tax.
Net Income Per Share
Net income per share attributable to Fiserv, Inc. in each period is calculated using actual, unrounded amounts. Basic net income per share is computed by dividing net income attributable to Fiserv, Inc. by the weighted-average number of common shares outstanding during the period. Diluted net income per share is computed by dividing net income attributable to Fiserv, Inc. by the weighted-average number of common shares and common stock equivalents outstanding during the period. Common stock equivalents consist of outstanding stock options, unvested restricted stock units and unvested restricted stock awards, and are computed using the treasury stock method. The Company excluded 1.3 million weighted-average shares in 2020 and 1.1 million in both 2019 and 2018 from the calculations of common stock equivalents for anti-dilutive stock options. The computation of shares used in calculating basic and diluted net income per share is as follows at December 31: | | | | | | | | | | | | | | | | | | | | |
| | | | | | |
| | | | | | |
| (In millions) | | 2020 | | 2019 | | 2018 |
| Weighted-average common shares outstanding used for the calculation of net income attributable to Fiserv, Inc. per share – basic | | 672.1 | | | 512.3 | | | 405.5 | |
| Common stock equivalents | | 11.3 | | | 10.3 | | | 8.2 | |
| Weighted-average common shares outstanding used for the calculation of net income attributable to Fiserv, Inc. per share – diluted | | 683.4 | | | 522.6 | | | 413.7 | |
| | | | | | |
Supplemental Cash Flow Information | | | | | | | | | | | | | | | | | | | | |
| | | | | | |
| (In millions) | | | | | | |
| Year Ended December 31, | | 2020 | | 2019 | | 2018 |
| Interest paid | | $ | 673 | | | $ | 291 | | | $ | 165 | |
| Income taxes paid | | 156 | | | 197 | | | 259 | |
| Treasury stock purchases settled after the balance sheet date | | — | | | 6 | | | 26 | |
| Distribution of nonmonetary assets (see Note 4) | | 726 | | | — | | | — | |
| Financed software arrangements | | 308 | | | — | | | — | |
| | | | | | |
| | | | | | |
2. Recent Accounting Pronouncements
Recently Adopted Accounting Pronouncements
In 2018, the Financial Accounting Standards Board (“FASB”) issued ASU No. 2018-15, Intangibles - Goodwill and Other - Internal-Use Software (Subtopic 350-40): Customer’s Accounting for Implementation Costs Incurred in a Cloud Computing Arrangement That Is a Service Contract (“ASU 2018-15”), which aligns the requirements for capitalizing implementation costs incurred in a cloud computing hosting arrangement that is a service contract within the requirements under ASC 350 for capitalizing implementation costs incurred to develop or obtain internal-use software. For public entities, ASU 2018-15 is effective for fiscal years, and interim periods within those years, beginning after December 15, 2019. Entities are permitted to apply either a retrospective or prospective transition approach to adopt the guidance. The Company adopted ASU 2018-15 effective January 1, 2020 using a prospective approach, and the adoption did not have a material impact on its consolidated financial statements.
In 2018, the FASB issued ASU No. 2018-14, Compensation - Retirement Benefits - Defined Benefit Plans - General (Subtopic 715-20): Disclosure Framework - Changes to the Disclosure Requirements for Defined Benefit Plans (“ASU 2018-14”), which removes, clarifies and adds certain disclosure requirements of ASC Topic 715, Compensation - Retirement Benefits. ASU 2018-14 is effective for fiscal years ending after December 15, 2020, with early adoption permitted. Entities must apply the disclosure updates retrospectively. The Company adopted ASU 2018-14 for the year ended December 31, 2020, and the adoption did not have a material impact on its disclosures.
In 2018, the FASB issued ASU No. 2018-13, Fair Value Measurement (Topic 820): Disclosure Framework - Changes to the Disclosure Requirements for Fair Value Measurement (“ASU 2018-13”), which removes, modifies, and adds certain disclosure requirements of ASC Topic 820, Fair Value Measurement. ASU 2018-13 is effective for fiscal years, including interim periods within those fiscal years, beginning after December 15, 2019 with the additional disclosures required to be applied prospectively and the modified and removed disclosures required to be applied retrospectively to all periods presented. The Company adopted ASU 2018-13 effective January 1, 2020, and the adoption did not have a material impact on its disclosures.
In 2016, the FASB issued ASU No. 2016-13, Financial Instruments - Credit Losses (Topic 326) (“ASU 2016-13” or “CECL”), which prescribes an impairment model for most financial instruments based on expected losses rather than incurred losses. Under this model, an estimate of expected credit losses over the contractual life of the instrument is to be recorded as of the end of a reporting period as an allowance to offset the amortized cost basis, resulting in a net presentation of the amount expected to be collected on the financial instrument. For public entities, ASU 2016-13 is effective for fiscal years, including interim periods within those fiscal years, beginning after December 15, 2019. For most instruments, entities must apply the standard using a cumulative-effect adjustment to beginning retained earnings as of the beginning of the fiscal year of adoption.
The Company adopted ASU 2016-13 effective January 1, 2020 using the required modified retrospective approach, which resulted in a cumulative-effect decrease to beginning retained earnings of $45 million. Financial assets and liabilities held by the Company subject to the “expected credit loss” model prescribed by CECL include trade and other receivables, net investments in leases, settlement assets and other credit exposures such as financial guarantees not accounted for as insurance.
In 2016, the FASB issued ASU No. 2016-02, which requires lessees to recognize a lease liability and a ROU asset for each lease with a term longer than twelve months and adds new presentation and disclosure requirements for both lessees and lessors. The accounting guidance for lessors remains largely unchanged. The recognized liability is measured at the present value of lease payments not yet paid, and the corresponding asset represents the lessee’s right to use the underlying asset over the lease term and is based on the liability, subject to certain adjustments. For income statement and statement of cash flow purposes, the standard retains the dual model with leases classified as either operating or finance. Operating leases will result in straight-line expense while finance leases will result in a front-loaded expense pattern. The standard prescribes a modified retrospective transition approach for leases existing at, or entered into after, the beginning of the earliest comparative period presented in the financial statements. ASU No. 2016-02 was subsequently amended by ASU No. 2018-01, Land Easement Practical Expedient for Transition to Topic 842; ASU No. 2018-10, Codification Improvements to Topic 842; ASU No. 2018-11, Leases (Topic 842) - Targeted Improvements (“ASU 2018-11”); ASU No. 2018-20, Narrow-Scope Improvements for Lessors; and ASU No. 2019-01, Leases (Topic 842) - Codification Improvements. ASU No. 2018-11 provides an additional transition method allowing entities to initially apply the new lease standard at the adoption date and recognize a cumulative-effect adjustment to the opening balance of retained earnings in the period of adoption. For public entities, ASU 2016-02 is effective for annual and interim periods beginning after December 15, 2018.
The Company adopted ASU No. 2016-02 effective January 1, 2019 using the optional transition method in ASU 2018-11. Under this method, the Company has not adjusted its comparative period financial statements for the effects of the new standard or made the new, expanded required disclosures for periods prior to the effective date. The Company elected the package of practical expedients permitted under the transition guidance in ASU 2016-02 to not reassess prior conclusions related to contracts containing leases, lease classification and initial direct costs. The Company also elected the practical expedient not to separate the non-lease components of a contract from the lease component to which they relate.
The adoption of the new lease standard resulted in the recognition of lease liabilities of $383 million and ROU assets of $343 million, which include the impact of existing deferred rents and tenant improvement allowances on the consolidated balance sheet as of January 1, 2019 for real and personal property operating leases. The adoption of ASU 2016-02 did not have a material impact on the Company’s consolidated statements of income or consolidated statements of cash flows.
In 2014, the FASB issued ASU No. 2014-09, Revenue from Contracts with Customers (“ASU 2014-09”), to clarify the principles of recognizing revenue and to create common revenue recognition guidance between U.S. generally accepted accounting principles and International Financial Reporting Standards. ASU 2014-09 outlines a single comprehensive model for entities to use in accounting for revenue arising from contracts with customers and supersedes most current revenue recognition guidance, including industry-specific requirements. It also includes guidance on accounting for the incremental costs of obtaining and costs incurred to fulfill a contract with a customer. The core principle of the revenue model is that an entity recognizes revenue to depict the transfer of promised goods or services to customers in an amount that reflects the consideration to which the entity expects to be entitled in exchange for those goods or services. This model involves a five-step process for achieving that core principle, along with comprehensive disclosures about the nature, amount, timing and uncertainty of revenue and cash flows arising from contracts with customers. For public entities, the new revenue standard is effective for annual and interim periods beginning after December 15, 2017. Entities have the option of adopting this new guidance using either a full retrospective or a modified approach with the cumulative effect of applying the guidance recognized at the date of initial application.
The Company adopted ASU 2014-09 effective January 1, 2018 using the modified retrospective transition approach applied to all contracts, which resulted in a cumulative-effect increase in the opening balance of retained earnings of $208 million, primarily related to the deferral of incremental sales commissions incurred in obtaining contracts in prior periods.
Recently Issued Accounting Pronouncements
In 2020, the FASB issued ASU No. 2020-01, Investments - Equity Securities (Topic 321), Investments - Equity Method and Joint Ventures (Topic 323), and Derivatives and Hedging (Topic 815): Clarifying the Interactions between Topic 321, Topic 323, and Topic 815 (“ASU 2020-01”), which clarifies certain interactions between the guidance to account for certain equity securities, investments under the equity method of accounting, and forward contracts or purchased options to purchase securities under Topic 321, Topic 323 and Topic 815. For public entities, ASU 2020-01 is effective for fiscal years, including interim periods within those fiscal years, beginning after December 15, 2020. The adoption of ASU 2020-01 will not have a material impact on the Company’s consolidated financial statements or disclosures.
In 2019, the FASB issued ASU No. 2019-12, Income Taxes (Topic 740): Simplifying the Accounting for Income Taxes (“ASU 2019-12”), which introduces a number of amendments that are designed to simplify the application of accounting for income taxes. Such amendments include removing certain exceptions for intraperiod tax allocation, interim reporting when a year-to-date loss exceeds the anticipated loss, reflecting the effect of an enacted change in tax laws or rates in the annual effective tax rate and recognition of deferred taxes related to outside basis differences for ownership changes in investments. ASU 2019-12 also provides clarification related to when a step up in the tax basis of goodwill should be considered part of the business combination in which the book goodwill was originally recognized and when it should be considered a separate transaction. In addition, ASU 2019-12 provides guidance on the recognition of a franchise tax (or similar tax) that is partially based on income as an income-based tax and accounting for any incremental amount incurred as a non-income-based tax. For public entities, ASU 2019-12 is effective for fiscal years, and interim periods within those fiscal years, beginning after December 15, 2020, with early adoption permitted. The adoption of ASU 2019-12 will not have a material impact on the Company’s consolidated financial statements.
3. Revenue Recognition
Significant Accounting Policy
ASU 2014-09 and its related amendments (collectively known as “ASC 606”) outlines a single comprehensive model to use in accounting for revenue arising from contracts with customers. The core principle, involving a five-step process, of the revenue model is that an entity recognizes revenue to depict the transfer of promised goods or services to customers in an amount that reflects the consideration to which the entity expects to be entitled in exchange for those goods or services.
Revenue is measured based on consideration specified in a contract with a customer, and excludes any amounts collected on behalf of third parties. Taxes assessed by a governmental authority that are both imposed on and concurrent with a specific revenue-producing transaction, that are collected by the Company from a customer, are excluded from revenue. Shipping and handling activities associated with outbound freight after control over a product has transferred to a customer are accounted for as a fulfillment activity and recognized as revenue at the point in time at which control of the goods transfers to the customer. As a practical expedient, the Company does not adjust the transaction price for the effects of a significant financing component if, at contract inception, the period between customer payment and the transfer of goods or services is expected to be one year or less.
Nature of Goods and Services
The Company’s operations are comprised of the Acceptance segment, the Fintech segment and the Payments segment. Additional information regarding the Company’s reportable segments is included in Note 21. The following is a description of principal activities from which the Company generates its revenue. Contracts with customers are evaluated on a contract-by-contract basis as contracts may include multiple types of goods and services as described below.
Processing and Services
Processing and services revenue is generated from account- and transaction-based fees for data processing, merchant transaction processing and acquiring, electronic billing and payment services, electronic funds transfer and debit/credit processing services; consulting and professional services; and software maintenance for ongoing client support.
The Company recognizes processing and services revenues in the period in which the specific service is performed unless they are not deemed distinct from other goods or services in which revenue would then be recognized as control is transferred of the combined goods and services. The Company’s arrangements for processing and services typically consist of an obligation to provide specific services to its customers on a when and if needed basis (a stand-ready obligation) and revenue is recognized from the satisfaction of the performance obligations in the amount billable to the customer. These services are typically provided under a fixed or declining (tier-based) price per unit based on volume of service; however, pricing for services may
also be based on minimum monthly usage fees. Fees for the Company’s processing and services arrangements are typically billed and paid on a monthly basis.
Product
Product revenue is generated from print and card production sales, as well as software license sales. For software license agreements that are distinct, the Company recognizes software license revenue upon delivery, assuming a contract is deemed to exist. Revenue for arrangements with customers that include significant customization, modification or production of software such that the software is not distinct is typically recognized over time based upon efforts expended, such as labor hours, to measure progress towards completion. For arrangements involving hosted licensed software for the customer, a software element is considered present to the extent the customer has the contractual right to take possession of the software at any time during the hosting period without significant penalty and it is feasible for the customer to either operate the software on their own hardware or contract with another vendor to host the software. In certain instances, the Company may offer extended payment terms beyond one year. To the extent a significant financing component exists, it is calculated as the difference between the promised consideration and the present value of the software license fees utilizing a discount rate reflective of a separate financing transaction, and is recognized as interest income over the extended payment period. The cash selling price of the software license fee is recognized as revenue at the point in time when the software is transferred to the customer.
The Company also sells or leases hardware (POS devices) and other peripherals as part of its contracts with customers. Hardware typically consists of terminals or Clover devices. The Company does not manufacture hardware, rather it purchases hardware from third-party vendors and holds such hardware in inventory until purchased by a customer. The Company accounts for sales of hardware as a separate performance obligation and recognizes the revenue at its standalone selling price when the customer obtains control of the hardware.
Significant Judgments in Application of the Guidance
The Company uses the following methods, inputs and assumptions in determining amounts of revenue to recognize:
Identification of Performance Obligations
To identify its performance obligations, the Company considers all of the goods or services promised in the contract regardless of whether they are explicitly stated or are implied by customary business practices. For multi-element arrangements, the Company accounts for individual goods or services as a separate performance obligation if they are distinct, the good or service is separately identifiable from other items in the arrangement and if a customer can benefit from it on its own or with other resources that are readily available to the customer. If these criteria are not met, the promised goods or services are accounted for as a combined performance obligation. Determining whether goods or services are distinct performance obligations that should be accounted for separately may require significant judgment.
Technology or service components from third parties are frequently embedded in or combined with the Company’s applications or service offerings. Whether the Company recognizes revenue based on the gross amount billed to a customer or the net amount retained involves judgment that depends on the relevant facts and circumstances including the level of contractual responsibilities and obligations for delivering solutions to end customers.
Determination of Transaction Price
The transaction price is determined based on the consideration to which the Company will be entitled in exchange for transferring products or services to the customer. The Company includes any fixed charges within its contracts as part of the total transaction price. To the extent that variable consideration is not constrained, the Company includes an estimate of the variable amount, as appropriate, within the total transaction price and updates its assumptions over the duration of the contract.
Assessment of Estimates of Variable Consideration
Many of the Company’s contracts with customers contain some component of variable consideration; however, the constraint will generally not result in a reduction in the estimated transaction price for most forms of variable consideration. The Company may constrain the estimated transaction price in the event of a high degree of uncertainty as to the final consideration amount owed because of an extended length of time over which the fees may be adjusted.
Allocation of Transaction Price
The transaction price (including any discounts or rebates) is allocated between separate goods and services in a multi-element arrangement based on their relative standalone selling prices. The standalone selling prices are determined based on the prices at which the Company separately sells each good or service. For items that are not sold separately, the Company estimates the
standalone selling prices using available information such as market conditions and internally approved pricing guidelines. In instances where there are observable selling prices for professional services and support and maintenance, the Company may apply the residual approach to estimate the standalone selling price of software licenses. Significant judgment may be required to determine standalone selling prices for each performance obligation and whether it depicts the amount the Company expects to receive in exchange for the related good or service.
Contract Modifications
Contract modifications occur when the Company and its customers agree to modify existing customer contracts to change the scope or price (or both) of the contract or when a customer terminates some, or all, of the existing services provided by the Company. When a contract modification occurs, it requires the Company to exercise judgment to determine if the modification should be accounted for as (i) a separate contract, (ii) the termination of the original contract and creation of a new contract, or (iii) a cumulative catch up adjustment to the original contract. Further, contract modifications require the identification and evaluation of the performance obligations of the modified contract, including the allocation of revenue to the remaining performance obligations and the period of recognition for each identified performance obligation.
Disaggregation of Revenue
The tables below present the Company’s revenue disaggregated by type of revenue, including a reconciliation with its reportable segments. The Company’s disaggregation of revenue for the years ended December 31, 2019 and 2018 have been restated to reflect the Segment Realignment. The majority of the Company’s revenue is earned domestically, with revenue generated outside the United States comprising approximately 13%, 12% and 6% of total revenue in 2020, 2019 and 2018, respectively. | | | | | | | | | | | | | | | | | | | | | | | | | | | | | |
| | | | | | | | | |
| (In millions) | Reportable Segments |
| Year Ended December 31, 2020 | Acceptance | | Fintech | | Payments | | Corporate
and Other | | Total |
| | | | | | | | | |
| Type of Revenue | | | | | | | | | |
| Processing | $ | 4,696 | | | $ | 1,426 | | | $ | 4,348 | | | $ | 58 | | | $ | 10,528 | |
Hardware, print and card production | 714 | | | 51 | | | 771 | | | — | | | 1,536 | |
Professional services | 29 | | | 465 | | | 233 | | | 1 | | | 728 | |
Software maintenance | — | | | 563 | | | 3 | | | 2 | | | 568 | |
License and termination fees | 28 | | | 189 | | | 68 | | | — | | | 285 | |
Output solutions postage | — | | | — | | | — | | | 864 | | | 864 | |
Other | 55 | | | 207 | | | 81 | | | — | | | 343 | |
| Total Revenue | $ | 5,522 | | | $ | 2,901 | | | $ | 5,504 | | | $ | 925 | | | $ | 14,852 | |
| | | | | | | | | |
| | | | | | | | | | | | | | | | | | | | | | | | | | | | | |
| | | | | | | | | |
| (In millions) | Reportable Segments |
| Year Ended December 31, 2019 | Acceptance | | Fintech | | Payments | | Corporate
and Other | | Total |
| | | | | | | | | |
Type of Revenue | | | | | | | | | |
| | | | | | | | | |
| | | | | | | | | |
| | | | | | | | | |
| | | | | | | | | |
Processing | $ | 2,205 | | | $ | 1,382 | | | $ | 3,110 | | | $ | 166 | | | $ | 6,863 | |
Hardware, print and card production | 323 | | | 51 | | | 458 | | | — | | | 832 | |
Professional services | 4 | | | 483 | | | 172 | | | 10 | | | 669 | |
Software maintenance | — | | | 570 | | | 3 | | | 15 | | | 588 | |
License and termination fees | 9 | | | 255 | | | 59 | | | 2 | | | 325 | |
Output solutions postage | — | | | — | | | — | | | 572 | | | 572 | |
| Other | 30 | | | 201 | | | 107 | | | — | | | 338 | |
| Total Revenue | $ | 2,571 | | | $ | 2,942 | | | $ | 3,909 | | | $ | 765 | | | $ | 10,187 | |
| | | | | | | | | |
| | | | | | | | | | | | | | | | | | | | | | | | | |
| | | | | | | | | |
| (In millions) | | | Reportable Segments |
| Year Ended December 31, 2018 | | | Fintech | | Payments | | Corporate
and Other | | Total |
| | | | | | | | | |
Type of Revenue | | | | | | | | | |
| | | | | | | | | |
| | | | | | | | | |
| | | | | | | | | |
| | | | | | | | | |
Processing | | | $ | 1,345 | | | $ | 1,900 | | | $ | 163 | | | $ | 3,408 | |
Hardware, print and card production | | | 41 | | | 304 | | | — | | | 345 | |
Professional services | | | 483 | | | 86 | | | 8 | | | 577 | |
Software maintenance | | | 577 | | | 3 | | | 15 | | | 595 | |
License and termination fees | | | 277 | | | 32 | | | 4 | | | 313 | |
Output solutions postage | | | — | | | — | | | 308 | | | 308 | |
| Other | | | 194 | | | 83 | | | — | | | 277 | |
| Total Revenue | | | $ | 2,917 | | | $ | 2,408 | | | $ | 498 | | | $ | 5,823 | |
| | | | | | | | | |
Contract Balances
The following table provides information about contract assets and contract liabilities from contracts with customers at December 31: | | | | | | | | | | | | | | | | | |
| | | | | |
| (In millions) | 2020 | | 2019 | | 2018 |
| Contract assets | $ | 433 | | | $ | 382 | | | $ | 171 | |
| Contract liabilities | 733 | | | 647 | | | 469 | |
| | | | | |
Contract assets, reported within other long-term assets in the consolidated balance sheets, primarily result from revenue being recognized where payment is contingent upon the transfer of services to a customer over the contractual period. Contract liabilities primarily relate to advance consideration received from customers (deferred revenue) for which transfer of control occurs, and therefore revenue is recognized, as services are provided. Contract balances are reported in a net contract asset or liability position on a contract-by-contract basis at the end of each reporting period. During the year ended December 31, 2020, contract assets and contract liabilities increased primarily due to customer discounts and deferred conversion revenue associated with long-term contracts obtained during the year. The Company recognized $492 million of revenue during the year ended December 31, 2020 that was included in the contract liabilities balance at the beginning of the period.
During the year ended December 31, 2019, contract assets and contract liabilities increased $153 million and $117 million, respectively, due to the acquisition of First Data. The Company recognized $380 million of revenue during the year ended December 31, 2019 that was included in the contract liabilities balance at the beginning of the period.
Transaction Price Allocated to Remaining Performance Obligations
The following table includes estimated processing, services and product revenue expected to be recognized in the future related to performance obligations that are unsatisfied (or partially unsatisfied) at December 31, 2020: | | | | | |
| |
| (In millions) | |
| Year Ending December 31, | |
| 2021 | $ | 2,000 | |
| 2022 | 1,658 | |
| 2023 | 1,355 | |
| 2024 | 982 | |
| Thereafter | 1,825 | |
| |
The Company applies the optional exemption under ASC 606 and does not disclose information about remaining performance obligations for account- and transaction-based processing fees that qualify for recognition under the as-invoiced practical expedient. These multi-year contracts contain variable consideration for stand-ready performance obligations for which the exact quantity and mix of transactions to be processed are contingent upon the customer’s request. The Company also applies
the optional exemptions under ASC 606 and does not disclose information for variable consideration that is a sales-based or usage-based royalty promised in exchange for a license of intellectual property or that is allocated entirely to a wholly unsatisfied performance obligation or to a wholly unsatisfied promise to transfer a distinct good or service in a series. The amounts disclosed above as remaining performance obligations consist primarily of fixed or monthly minimum processing fees and maintenance fees under contracts with an original expected duration of greater than one year.
Contract Costs
The Company incurs incremental costs to obtain a contract as well as costs to fulfill contracts with customers that are expected to be recovered. These costs consist primarily of sales commissions incurred only if a contract is obtained, and customer conversion or implementation related costs. Capitalized sales commissions and conversion or implementation costs were as follows at December 31: | | | | | | | | | | | | | | |
| | | | |
| (In millions) | | 2020 | | 2019 |
| Capitalized sales commissions | | $ | 402 | | | $ | 357 | |
| Capitalized conversion or implementation costs | | 290 | | | 176 | |
| | | | |
Capitalized contract costs are amortized based on the transfer of goods or services to which the asset relates. The amortization period also considers expected customer lives and whether the asset relates to goods or services transferred under a specific anticipated contract. These costs are primarily included in selling, general and administrative expenses and totaled $124 million, $105 million and $106 million during the years ended December 31, 2020, 2019 and 2018, respectively. Impairment losses recognized during the years ended December 31, 2020, 2019 and 2018 related to capitalized contract costs were not significant.
4. Acquisitions and Dispositions
Acquisition of First Data
On July 29, 2019, the Company acquired First Data, a global leader in commerce-enabling technology and solutions for merchants, financial institutions and card issuers, by acquiring 100% of the First Data stock that was issued and outstanding as of the date of acquisition. The acquisition, included within the Acceptance and Payments segments, increases the Company’s footprint as a global payments and financial technology provider by expanding the portfolio of services provided to financial institutions, corporate and merchant clients and consumers.
As a result of the acquisition, First Data stockholders received 286 million shares of common stock of Fiserv, Inc., at an exchange ratio of 0.303 shares of Fiserv, Inc. for each share of First Data common stock, with cash paid in lieu of fractional shares. The Company also converted 15 million outstanding First Data equity awards into corresponding equity awards relating to common stock of Fiserv, Inc. in accordance with the exchange ratio as described in further detail within Note 16. In addition, concurrent with the closing of the acquisition, the Company made a cash payment of $16.4 billion to repay existing First Data debt. The Company funded the transaction-related expenses and the repayment of First Data debt through a combination of available cash on-hand and proceeds from debt issuances as discussed in Note 12.
The total purchase price paid for First Data is as follows: | | | | | |
| |
| (In millions) | |
Fair value of stock exchanged for shares of Fiserv, Inc. (1) | $ | 29,293 | |
| Repayment of First Data debt | 16,414 | |
Fair value of vested portion of First Data stock awards exchanged for Fiserv, Inc. awards (2) | 768 | |
| Total purchase price | $ | 46,475 | |
| |
(1)The fair value of the 286 million shares of the Company’s common stock issued as of the acquisition date was determined based on a per share price of $102.30, which was the closing price of the Company’s common stock on July 26, 2019, the last trading day before the acquisition closed the morning of July 29, 2019. This includes a nominal amount of cash paid in lieu of fractional shares.
(2)Represents the portion of the fair value of the replacement awards related to services provided prior to the acquisition. The remaining portion of the fair value is associated with future service and will be recognized as expense over the future service period. See Note 16 for additional information.
The acquisition was accounted for as a business combination using the acquisition method of accounting in accordance with ASC 805, Business Combinations (“ASC 805”). The purchase price was allocated to the assets acquired and liabilities assumed
based on the estimated fair values at the date of acquisition. The excess of the purchase price over the fair value of the net assets acquired was allocated to goodwill, none of which is deductible for tax purposes. Goodwill is primarily attributed to synergies from future expected economic benefits, including enhanced revenue growth from expanded capabilities and geographic presence as well as substantial cost savings from duplicative overhead, streamlined operations and enhanced operational efficiency.
The assets and liabilities of First Data have been measured at estimated fair value as of the acquisition date. During the current year through the measurement period ended July 29, 2020, the Company identified and recorded measurement period adjustments to the preliminary purchase price allocation, which were the result of additional analysis performed and information identified based on facts and circumstances that existed as of the acquisition date. These measurement period adjustments resulted in an increase to goodwill of $304 million. The offsetting amounts to the change in goodwill were primarily related to customer relationship intangible assets, noncontrolling interests, property and equipment, payables and accrued expenses including legal contingency reserves, and deferred income taxes. The Company recorded a measurement period adjustment of $155 million to reduce the fair value of customer relationship intangible assets as a result of refinements to attrition rates. A measurement period adjustment of $126 million was recorded to reduce the fair value of noncontrolling interests based on changes to the fair value of the underlying customer relationship intangible assets and the incorporation of additional facts and circumstances that existed as of the acquisition date. A measurement period adjustment of $25 million was recorded to reduce the fair value of property and equipment to the estimated fair value of certain real property acquired. Measurement period adjustments were recorded to increase payables and accrued expenses by $37 million, reduce investments in unconsolidated affiliates by $23 million, and increase other long-term liabilities by $21 million. The remaining $169 million of adjustments were primarily comprised of deferred tax adjustments related to the measurement period adjustments. Such measurement period adjustments did not have a material impact on the consolidated statements of income. The allocation of purchase price recorded for First Data was finalized in the third quarter of 2020 as follows: | | | | | |
| |
| (In millions) | |
Assets acquired (1) | |
| Cash and cash equivalents | $ | 310 | |
| Trade accounts receivable | 1,747 | |
| Prepaid expenses and other current assets | 1,047 | |
| Settlement assets | 10,398 | |
| Property and equipment | 1,156 | |
| Customer relationships | 13,458 | |
| Other intangible assets | 2,814 | |
| Goodwill | 30,811 | |
| Investments in unconsolidated affiliates | 2,676 | |
| Other long-term assets | 1,191 | |
| Total assets acquired | $ | 65,608 | |
| |
Liabilities assumed (1) | |
| Accounts payable and accrued expenses | $ | 1,613 | |
Short-term and current maturities of long-term debt (2) | 243 | |
| Contract liabilities | 71 | |
| Settlement obligations | 10,398 | |
| Deferred income taxes | 3,671 | |
| Long-term contract liabilities | 16 | |
Long-term debt and other long-term liabilities (3) | 1,261 | |
| Total liabilities assumed | $ | 17,273 | |
| |
| Net assets acquired | $ | 48,335 | |
| Redeemable noncontrolling interests | 252 | |
| Noncontrolling interests | 1,608 | |
| Total purchase price | $ | 46,475 | |
| |
(1)In connection with the acquisition of First Data, the Company acquired two businesses which it intended to sell and subsequently sold in October 2019. Therefore, such businesses were classified as held for sale and were included within prepaid expenses and other current assets and accounts payable and accrued expenses in the above allocation of purchase price (see Note 5).
(2)Includes foreign lines of credit, current portion of finance lease obligations and other financing obligations (see Note 12).
(3)Includes the receivable securitized loan and the long-term portion of finance lease obligations (see Note 12).
The fair values of the assets acquired and liabilities assumed were determined using the income and cost approaches. In many cases, the determination of the fair values required estimates about discount rates, growth and attrition rates, future expected cash flows and other future events that are judgmental. The fair value measurements were primarily based on significant inputs that are not observable in the market and thus represent a Level 3 measurement of the fair value hierarchy as defined in ASC 820, Fair Value Measurements. Intangible assets consisting of customer relationships, technology and trade names were valued using the multi-period excess earnings method (“MEEM”), or the relief from royalty (“RFR”) method, both are forms of the income approach. A cost and market approach was applied, as appropriate, for property and equipment, including land.
•Customer relationship intangible assets were valued using the MEEM method. The significant assumptions used include the estimated annual net cash flows (including appropriate revenue and profit attributable to the asset, retention rate, applicable tax rate, and contributory asset charges, among other factors), the discount rate, reflecting the risks inherent in the future cash flow stream, an assessment of the asset’s life cycle, and the tax amortization benefit, among other factors.
•Technology and trade name intangible assets were valued using the RFR method. The significant assumptions used include the estimated annual net cash flows (including appropriate revenue attributable to the asset, applicable tax rate,
royalty rate, and other factors such as technology related obsolescence rates), the discount rate, reflecting the risks inherent in the future cash flow stream, and the tax amortization benefit, among other factors.
•The cost approach, which estimates value by determining the current cost of replacing an asset with another of equivalent economic utility, was used, as appropriate, for property and equipment. The cost to replace a given asset reflects the estimated reproduction or replacement cost for the property, less an allowance for loss in value due to depreciation.
•The market approach, which estimates value by leveraging comparable land sale data/listings and qualitatively comparing them to the in-scope properties, was used to value the land.
•An income approach was applied to derive fair value for both consolidated investments with a noncontrolling interest and equity method investments accounted for under the equity method of accounting. The significant assumptions used include the estimated annual cash flows, the discount rate, the long-term growth rate, and operating margin, among other factors.
The Company believes that the information provided a reasonable basis for estimating the fair values of the acquired assets and assumed liabilities.
The amounts allocated to intangible assets are as follows: | | | | | | | | | | | |
| | | |
| (In millions) | Gross Carrying Amount | | Weighted-Average Useful Life |
| Customer relationships | $ | 13,458 | | | 15 years |
| Acquired software and technology | 2,324 | | | 7 years |
| Trade names | 490 | | | 9 years |
| Total | $ | 16,272 | | | 14 years |
| | | |
The financial results of First Data are included in the consolidated results of the Company from July 29, 2019, the date of acquisition. For the year ended December 31, 2019, the results of operations for First Data, included within the accompanying consolidated statement of income, consisted of $4.1 billion of revenue and $1.0 billion of operating income. The Company incurred transaction expenses of approximately $175 million for the year ended December 31, 2019. Approximately $77 million of these expenses were included in selling, general and administrative expenses and $98 million were included in debt financing activities within the Company’s consolidated statement of income for the year ended December 31, 2019.
The following unaudited supplemental pro forma combined financial information presents the Company’s results of operations for the years ended December 31, 2019 and 2018 as if the acquisition of First Data had occurred on January 1, 2018. The pro forma financial information is presented for comparative purposes only and is not necessarily indicative of the Company’s operating results that may have actually occurred had the acquisition of First Data been completed on January 1, 2018. In addition, the unaudited pro forma financial information does not give effect to any anticipated cost savings, operating efficiencies or other synergies that may be associated with the acquisition, or any estimated costs that have been or will be incurred by the Company to integrate the assets and operations of First Data. | | | | | | | | | | | |
| | | |
| (In millions, except for per share data) | 2019 | | 2018 |
| Total revenue | $ | 15,775 | | | $ | 15,284 | |
| Net income | 1,520 | | | 1,125 | |
| Net income attributable to Fiserv, Inc. | 1,457 | | | 1,040 | |
| Net income per share attributable to Fiserv, Inc.: | | | |
| Basic | $ | 2.14 | | | $ | 1.50 | |
| Diluted | $ | 2.10 | | | $ | 1.47 | |
| | | |
The unaudited pro forma financial information reflects pro forma adjustments to present the combined pro forma results of operations as if the acquisition had occurred on January 1, 2018 to give effect to certain events the Company believes to be directly attributable to the acquisition. These pro forma adjustments primarily include: •a net increase in amortization expense that would have been recognized due to acquired intangible assets;
•an adjustment to interest expense to reflect (i) the additional borrowings of the Company in conjunction with the acquisition and (ii) the repayment of First Data’s historical debt in conjunction with the acquisition;
•a reduction in expenses for the year ended December 31, 2019 and a corresponding increase in the year ended December 31, 2018 for acquisition-related transaction costs and other one-time costs directly attributable to the acquisition;
•a reduction in operating revenues due to the elimination of deferred revenues assigned no value at the acquisition date;
•an adjustment to stock compensation expense to reflect the cost of the replacement awards as if they had been issued on January 1, 2018; and
•the related income tax effects of the adjustments noted above.
Acquisition of Elan Assets
On October 31, 2018, the Company acquired the debit card processing, ATM Managed Services, and MoneyPass® surcharge-free network of Elan Financial Services, a unit of U.S. Bancorp (“Elan”), for approximately $659 million. Such purchase price includes an initial cash payment of $691 million, less post-closing working capital adjustments of $57 million, plus contingent consideration related to earn-out provisions estimated at a fair value of $12 million (see Note 10) and future payments under a transition services agreement estimated to be in excess of fair value of $13 million. This acquisition, included within the Payments segment, deepens the Company’s presence in debit card processing, broadens its client reach and scale and provides new solutions to enhance the value proposition for its existing debit solution clients.
During 2019, the Company identified and recorded measurement period adjustments to the preliminary purchase price allocation, which were the result of additional analysis performed and information identified based on facts and circumstances that existed as of the acquisition date. The measurement period adjustments resulted in a decrease in goodwill of $24 million with an offset to intangible assets and prepaid expenses and other current assets. The following allocation of purchase price for Elan was finalized in 2019: | | | | | |
| |
| (In millions) | |
| Trade accounts receivable | $ | 20 | |
| Prepaid expenses and other current assets | 98 | |
| Property and equipment | 9 | |
| Intangible assets | 373 | |
| Goodwill | 214 | |
| Accounts payable and other current liabilities | (55) | |
| Total purchase price | $ | 659 | |
| |
Goodwill, deductible for tax purposes, is primarily attributed to synergies, including the migration of Elan’s clients to the Company’s debit platform, and the anticipated value created by selling the Company’s products and services outside of card payments to Elan’s existing client base. The amounts allocated to intangible assets are as follows: | | | | | | | | | | | |
| | | |
| (In millions) | Gross Carrying Amount | | Weighted-Average Useful Life |
| Customer relationships | $ | 370 | | | 15 years |
| Trade name | 3 | | | 8 years |
| Total | $ | 373 | | | 15 years |
| | | |
In conjunction with the acquisition, the Company entered into a transition services agreement for the provision of certain processing, network, administrative and managed services for a period of two years. The financial results of Elan are included in the consolidated results of the Company from October 31, 2018, the date of acquisition. For the year ended December 31, 2018, the results of operations for Elan, included within the accompanying consolidated statement of income, consisted of $29 million of revenue and $6 million of operating income. Pro forma information for this acquisition is not provided because it did not have a material effect on the Company’s consolidated results of operations. Other Acquisitions
On March 2, 2020, the Company acquired MerchantPro Express LLC (“MerchantPro”), an independent sales organization that provides processing services, point-of-sale equipment and merchant cash advances to businesses across the United States. MerchantPro is included within the Acceptance segment and further expands the Company’s merchant services business. On March 18, 2020, the Company acquired Bypass Mobile, LLC (“Bypass”), an independent software vendor and innovator in enterprise point-of-sale systems for sports and entertainment venues, food service management providers and national
restaurant chains. Bypass is included within the Acceptance segment and further enhances the Company’s omni-commerce capabilities, enabling enterprise businesses to deliver a seamless customer experience that spans physical and digital channels. On May 11, 2020, the Company acquired Inlet, LLC (“Inlet”), a provider of secure digital delivery solutions for enterprise and middle-market billers’ invoices and statements. Inlet is included within the Payments segment and further enhances the Company’s digital bill payment strategy.
The Company acquired these businesses for an aggregate purchase price of $167 million, net of $2 million of acquired cash, and including earn-out provisions estimated at a fair value of $45 million (see Note 10). The purchase price allocations for these acquisitions resulted in software and customer intangible assets totaling approximately $46 million, residual buyout intangible assets of approximately $35 million, goodwill of approximately $90 million, and net assumed liabilities of approximately $4 million. The purchase price allocation for the MerchantPro acquisition was finalized in the third quarter of 2020, and for the Bypass and Inlet acquisitions in the fourth quarter of 2020. Measurement period adjustments did not have a material impact on the consolidated statements of income. The goodwill recognized from these transactions is primarily attributed to synergies and the anticipated value created by selling the Company’s products and services to the acquired businesses’ existing client base. Approximately $36 million of goodwill is expected to be deductible for tax purposes.
The amounts allocated to intangible assets are as follows: | | | | | | | | | | | |
| | | |
| (In millions) | Gross Carrying Amount | | Weighted-Average Useful Life |
| Customer relationships | $ | 32 | | | 14 years |
| Residual buyouts | 35 | | | 9 years |
| Acquired software and technology | 14 | | | 8 years |
| Total | $ | 81 | | | 11 years |
| | | |
The results of operations for these acquired businesses have been included in the accompanying consolidated statements of income from the dates of acquisition. Pro forma information for these acquisitions is not provided because they did not have a material effect on the Company’s consolidated results of operations. On January 22, 2021, the Company acquired Ondot Systems, Inc., a digital experience platform provider for financial institutions. This acquisition, to be included within the Payments segment, will further expand the Company’s digital capabilities, enhancing its suite of integrated solutions spanning card-based payments, digital banking platforms, core banking, and merchant solutions to enable clients of all sizes to deliver frictionless, digital-first and personalized experiences to their customers.
Dispositions
Effective July 1, 2020, the Company and Bank of America (“BANA”) dissolved the Banc of America Merchant Services joint venture (“BAMS” or the “joint venture”), of which the Company maintained a 51% controlling ownership interest. Upon dissolution of the joint venture’s operations, the joint venture transferred a proportionate share of value, primarily the client contracts, to each party via an agreed upon contractual separation. The remaining activities of the joint venture will consist of supporting the transition of the business to each party and an orderly wind down of remaining BAMS assets and liabilities. Pursuant to the separation agreement, the joint venture retains the responsibility for certain contingencies that may arise from pre-dissolution activities, including potential credit losses for specified merchants in excess of established reserves and certain legal claims and contingencies. The Company may be obligated to fund a proportionate share of any such losses as incurred.
The transfer of value to BANA was accounted for at fair value as a non pro rata distribution of nonmonetary assets, resulting in the recognition of a pre-tax gain of $36 million, with a related tax expense of $13 million. The pre-tax gain included the revaluation of client contracts allocated to BANA to a fair value of $700 million, as well as an estimated $24 million for certain additional consideration due from the Company to BANA in connection with the dissolution. The pre-tax net gain is recorded within gain on sale of businesses and the tax expense is recorded within the income tax provision in the consolidated statement of income for the year ended December 31, 2020. Noncontrolling interests of the Company have been reduced by $726 million and the Company’s additional paid-in capital was reduced by $36 million to account for the wind down of the joint venture and the transfer of a proportionate share of the joint venture’s fair value to BANA. The transfer of value to the Company was accounted for at carryover basis as the Company maintains control of such assets. The business transferred to the Company will continue to be operated and managed within the Company’s Acceptance segment.
The fair value of the client contracts upon dissolution of the joint venture was determined using the MEEM method, a form of the income approach. The determination of the fair values required estimates about discount rates, growth and attrition rates,
future expected cash flows and other future events that are judgmental in nature. The fair value measurements were primarily based on significant inputs that are not observable in the market and thus represent a Level 3 measurement of the fair value hierarchy as defined in ASC 820, Fair Value Measurements. The significant assumptions used include the estimated annual net cash flows (including appropriate revenue and profit attributable to the asset, retention rate, applicable tax rate, and contributory asset charges, among other factors), the discount rate, reflecting the risks inherent in the future cash flow stream, an assessment of the asset’s life cycle, and the tax amortization benefit, among other factors.
The Company will continue to provide merchant processing and related services to former BAMS clients allocated to BANA, at BAMS pricing, through June 2023. The Company will also provide processing and other support services to new BANA merchant clients pursuant to a five-year non-exclusive agreement which, after June 2023, will also apply to the former BAMS clients allocated to BANA. In addition, both the Company and BANA are entitled to certain transition services, at fair value, from each other through June 2023.
On February 18, 2020, the Company sold a 60% controlling interest of its Investment Services business, subsequently renamed as Tegra118, LLC (“Tegra118”), which is reported within Corporate and Other following the Segment Realignment. The Company received pre-tax proceeds of $578 million, net of related expenses, resulting in a pre-tax gain on the sale of $428 million, with the related tax expense of $112 million recorded through the income tax provision, in the consolidated statement of income for the year ended December 31, 2020. The pre-tax gain included $176 million related to the remeasurement of the Company’s 40% retained interest based upon the enterprise value of the business. The revenues, expenses and cash flows of the Investment Services business were consolidated into the Company’s financial results through the date of the sale transaction. In conjunction with the sale transaction, the Company also entered into transition services agreements to provide, at fair value, various administration, business process outsourcing, technical and data center related services for defined periods to Tegra118 (see Note 20). The Company’s remaining ownership interest in Tegra118 is accounted for as an equity method investment (see Note 9). On February 2, 2021, Tegra118 completed a merger with a third party, resulting in a dilution of the Company’s ownership interest in the combined new entity, Wealthtech Holdings, LLC.
On March 29, 2018, the Company sold a 55% controlling interest of each of Fiserv Automotive Solutions, LLC and Fiserv LS LLC, which were subsidiaries of the Company that owned its Lending Solutions business (collectively, the “Lending Joint Ventures”). The Lending Joint Ventures, which were reported within the Fintech segment, included all of the Company’s automotive loan origination and servicing products, as well as its LoanServ™ mortgage and consumer loan servicing platform. The Company received gross sale proceeds of $419 million from the transactions. In 2018, the Company recognized a pre-tax gain on the sale of $227 million, with the related tax expense of $77 million recorded through the income tax provision, in the consolidated statement of income. The pre-tax gain included $124 million related to the remeasurement of the Company’s 45% retained interests based upon the estimated enterprise value of the Lending Joint Ventures. In 2019, the Company recognized a pre-tax gain on the sale of $10 million, with the related tax expense of $2 million recorded through the income tax provision, as contingent special distribution provisions within the transaction agreement were resolved and thereby realized. In August 2019, the Sagent Auto, LLC joint venture, formerly known as Fiserv Automotive Solutions, LLC, completed a merger with a third party, resulting in a dilution of the Company’s ownership interest in the combined entity, defi SOLUTIONS Group, LLC (“defi SOLUTIONS”). The Company recognized a pre-tax gain of $14 million within income from investments in unconsolidated affiliates in the consolidated statement of income, with related tax expense of $3 million, in 2019, reflecting the Company’s 31% ownership interest in defi SOLUTIONS. The Company’s remaining ownership interests in the Lending Joint Ventures are accounted for as equity method investments (see Note 9). See Note 20 for information regarding transition service agreements with the Lending Joint Ventures.
5. Discontinued Operations
In connection with the acquisition of First Data, the Company acquired two businesses, which it intended to sell. In October 2019, the Company completed the sales, at acquired fair value, of these two businesses for aggregate proceeds of $133 million. The sale proceeds are presented within discontinued operations in the consolidated statement of cash flows since the businesses were never considered part of the Company’s ongoing operations. The financial results of these businesses from the date of acquisition were not significant.
In January 2018, the Company completed the sale of the retail voucher business, MyVoucherCodes, acquired as part of its acquisition of Monitise plc in September 2017 for proceeds of £37 million ($50 million). The corresponding proceeds received in 2018 are presented within discontinued operations since the business was never considered part of the Company’s ongoing operations. There was no impact to operating income or gain/loss recognized on the sale in 2018. Cash flows from discontinued operations in 2018 also included tax payments of $7 million related to income recognized in 2017 from a litigation settlement related to a prior disposition.
6. Settlement Assets and Obligations
Settlement assets and obligations represent intermediary balances arising from the settlement process which involves the transferring of funds between card issuers, payment networks, merchants and consumers. The Company records settlement assets and obligations upon processing a payment transaction. Settlement assets represent amounts receivable from agents and from payment networks for submitted merchant transactions, and funds received by the Company in advance of paying to the merchant or payee. Settlement obligations represent the unpaid amounts that are due to merchants or payees for their payment transactions.
The principal components of the Company’s settlement assets and obligations were as follows at December 31: | | | | | | | | | | | |
| | | |
| (In millions) | 2020 | | 2019 |
| Settlement assets | | | |
| Cash and cash equivalents | $ | 1,825 | | | $ | 1,656 | |
| Receivables | 9,696 | | | 10,212 | |
| Total settlement assets | $ | 11,521 | | | $ | 11,868 | |
| Settlement obligations | | | |
| Payment instruments outstanding | $ | 483 | | | $ | 345 | |
| Card settlements due to merchants | 11,038 | | | 11,523 | |
| Total settlement obligations | $ | 11,521 | | | $ | 11,868 | |
| | | |
The changes in settlement assets and obligations are presented on a net basis within operating activities in the consolidated statements of cash flows. However, because the changes in the settlement assets balance exactly offset changes in settlement obligations, the activity nets to zero. 7. Intangible Assets
Identifiable intangible assets consisted of the following at December 31: | | | | | | | | | | | | | | | | | | | | |
| | | | | | |
| (In millions) | | Gross
Carrying
Amount | | Accumulated
Amortization | | Net Book
Value |
| 2020 | |
| Customer relationships | | $ | 15,271 | | | $ | 3,668 | | | $ | 11,603 | |
| Acquired software and technology | | 2,562 | | | 879 | | | 1,683 | |
| Trade names | | 618 | | | 172 | | | 446 | |
| Purchased software | | 913 | | | 207 | | | 706 | |
| Capitalized software and other intangibles | | 1,332 | | | 412 | | | 920 | |
| Total | | $ | 20,696 | | | $ | 5,338 | | | $ | 15,358 | |
| | | | | | |
| (In millions) | | Gross
Carrying
Amount | | Accumulated
Amortization | | Net Book
Value |
| 2019 | |
| Customer relationships | | $ | 16,187 | | | $ | 2,145 | | | $ | 14,042 | |
| Acquired software and technology | | 2,607 | | | 639 | | | 1,968 | |
| Trade names | | 620 | | | 105 | | | 515 | |
| Purchased software | | 680 | | | 173 | | | 507 | |
| Capitalized software and other intangibles | | 942 | | | 332 | | | 610 | |
| Total | | $ | 21,036 | | | $ | 3,394 | | | $ | 17,642 | |
| | | | | | |
Gross software development costs capitalized for new products and enhancements to existing products totaled $462 million, $339 million and $193 million in 2020, 2019 and 2018, respectively.
Amortization expense associated with the above identifiable intangible assets was as follows for the years ended December 31: | | | | | | | | | | | | | | | | | | | | |
| | | | | | |
| (In millions) | | 2020 | | 2019 | | 2018 |
| Amortization expense | | $ | 2,563 | | | $ | 1,299 | | | $ | 347 | |
| | | | | | |
Amortization expense during the year ended December 31, 2020 includes $56 million of accelerated amortization associated with the termination of certain vendor contracts (see Note 17).
The Company estimates that annual amortization expense with respect to intangible assets recorded at December 31, 2020 will be as follows: | | | | | | | | |
| | |
| (In millions) | | |
| Year Ending December 31, | |
| 2021 | | $ | 2,451 | |
| 2022 | | 2,262 | |
| 2023 | | 2,010 | |
| 2024 | | 1,616 | |
| 2025 | | 1,342 | |
| Thereafter | | 5,677 | |
| Total | | $ | 15,358 | |
| | |
8. Goodwill
The following table presents changes in goodwill during 2020 and 2019. Prior period amounts have been restated to reflect the Segment Realignment. | | | | | | | | | | | | | | | | | | | | | | | | | | | | | | | | |
| | | | | | | | | | |
| | Reportable Segments |
| (In millions) | | Acceptance | | Fintech | | Payments | | Corporate
and Other | | Total |
| Goodwill - December 31, 2018 | | $ | — | | | $ | 2,102 | | | $ | 3,380 | | | $ | 220 | | | $ | 5,702 | |
| Acquisitions and valuation adjustments | | 21,178 | | | 2 | | | 9,302 | | | — | | | 30,482 | |
| Dispositions | | — | | | (2) | | | — | | | — | | | (2) | |
| Goodwill reclassified to assets held for sale | | — | | | — | | | — | | | (220) | | | (220) | |
| Foreign currency translation | | 11 | | | 2 | | | 63 | | | — | | | 76 | |
| Goodwill - December 31, 2019 | | 21,189 | | | 2,104 | | | 12,745 | | | — | | | 36,038 | |
| Acquisitions and valuation adjustments | | 332 | | | — | | | 62 | | | — | | | 394 | |
| | | | | | | | | | |
| Foreign currency translation | | (113) | | | 4 | | | (1) | | | — | | | (110) | |
| Goodwill - December 31, 2020 | | $ | 21,408 | | | $ | 2,108 | | | $ | 12,806 | | | $ | — | | | $ | 36,322 | |
| | | | | | | | | | |
In December 2019, the Company entered into a definitive agreement to sell a 60% controlling interest of its Investment Services business, and subsequently completed the sale on February 18, 2020, which is reported within Corporate and Other following the Segment Realignment (see Note 4). As a result, the corresponding assets of the Investment Services business, including $220 million of goodwill, were classified as held for sale within prepaid expenses and other current assets in the Company’s consolidated balance sheet at December 31, 2019.
9. Investments in Unconsolidated Affiliates
The Company maintains investments in various affiliates that are accounted for as equity method investments at both December 31, 2020 and 2019, the most significant of which are related to the Company’s merchant bank alliance affiliates. The Company’s share of net income or loss from these investments is reported within income from investments in unconsolidated affiliates and the related tax expense or benefit is reported within the income tax provision in the consolidated statements of income.
Merchant Alliances
The Company maintains ownership interests of significant influence in various merchant alliances and strategic investments in companies in related markets. A merchant alliance, as it pertains to investments accounted for under the equity method, is an agreement between the Company and a financial institution that combines the processing capabilities and management expertise of the Company with the visibility and distribution channel of the bank. A merchant alliance acquires credit and debit card transactions from merchants. The Company provides processing and other services to the alliance and charges fees to the alliance primarily based on contractual pricing (see Note 20). The Company’s investment in its merchant alliances was $2.4 billion and $2.5 billion at December 31, 2020 and 2019, respectively, and is reported within investments in unconsolidated affiliates in the consolidated balance sheets.
Other Equity Method Investments
Following the sale of a controlling financial interest of the Investment Services business (see Note 4), as of December 31, 2020, the Company maintained a 40% ownership interest in Tegra 118 which is accounted for as an equity method investment. The Company also maintains a 45% ownership interest in Sagent M&C, LLC (formerly known as Fiserv LS, LLC) and a 31% ownership interest in defi SOLUTIONS, which are accounted for as equity method investments (see Note 4). The Company’s aggregate investment in these entities was $212 million and $56 million at December 31, 2020 and 2019, respectively, and is reported within investments in unconsolidated affiliates in the consolidated balance sheets.
The Lending Joint Ventures maintain variable-rate term loan facilities with aggregate outstanding borrowings of $385 million in senior unsecured debt and variable-rate revolving credit facilities with an aggregate borrowing capacity of $45 million with a syndicate of banks, which mature in March 2023. Outstanding borrowings on the revolving credit facilities at December 31, 2020 were $13 million. The Company has guaranteed this debt of the Lending Joint Ventures and does not anticipate that the Lending Joint Ventures will fail to fulfill their debt obligations. See Note 10 for additional information regarding the Company’s debt guarantee arrangements with the Lending Joint Ventures.
Summary of Financial Information
The following tables present a summary of financial information for the Company’s unconsolidated affiliates accounted for under the equity method of accounting: | | | | | | | | | | | | | |
| | | | | |
| (In millions) | | | | | |
| December 31, | 2020 | | 2019 | | |
| Total current assets | $ | 5,534 | | | $ | 4,288 | | | |
| Total long-term assets | 769 | | | 1 | | | |
| Total assets | $ | 6,303 | | | $ | 4,289 | | | |
| | | | | | |
| Total current liabilities | $ | 5,478 | | | $ | 4,243 | | | |
| Total long-term liabilities | 336 | | | — | | | |
| Total liabilities | $ | 5,814 | | | $ | 4,243 | | | |
| | | | | |
The primary components of assets and liabilities are settlement asset and obligation related accounts similar to those described in Note 6 to the consolidated financial statements. | | | | | | | | | | | |
| | | |
| (In millions) | | | |
| Year Ended December 31, | 2020 | | 2019 |
| Total revenue | $ | 963 | | | $ | 467 | |
| Total expenses | 597 | | | 249 | |
| Operating income | $ | 366 | | | $ | 218 | |
| Net income | $ | 351 | | | $ | 215 | |
| | | |
| | | |
The Company’s share of investee’s net income or loss includes the amortization basis difference between the estimated fair value and the underlying book value of equity method intangible assets.
The Company classifies distributions from its investments accounted for using the equity method in the consolidated statements of cash flows using the cumulative earnings approach. Under this approach, distributions received from
unconsolidated affiliates are classified as cash flows from operating activities to the extent that the cumulative distributions do not exceed the cumulative earnings on the investment. To the extent the current period distribution exceeds the cumulative earnings on the investment, the distribution is considered a return of investment and is classified as cash flows from investing activities. The Company received cash distributions from unconsolidated affiliates of $151 million, $136 million and $2 million, of which $109 million, $113 million and $0 million were recorded as cash flows from investing activities in the Company’s consolidated statements of cash flows during 2020, 2019 and 2018, respectively.
The Company also maintains investments in various equity securities without a readily determinable fair value. Such investments totaled $160 million and $167 million at December 31, 2020 and 2019, respectively, and are included within other long-term assets in the Company’s consolidated balance sheets. The Company reviews these investments each reporting period to determine whether an impairment or observable price change for the investment has occurred. When such events or changes occur, the Company evaluates the fair value compared to its cost basis in the investment. Gains or losses from a change in fair value are included within other income (expense) in the consolidated statement of income for the period. Adjustments made to the values recorded for these equity securities during 2020, 2019 and 2018 were not significant.
10. Fair Value Measurements
The fair values of cash equivalents, trade accounts receivable, settlement assets and obligations, accounts payable, and client deposits approximate their respective carrying values due to the short period of time to maturity. The Company’s derivative instruments are measured on a recurring basis based on foreign currency spot rates and forwards quoted by banks and foreign currency dealers and are marked-to-market each period (see Note 14). Contingent consideration related to the 2020 acquisitions of MerchantPro and Bypass and 2018 acquisition of Elan (see Note 4) is estimated based on the present value of a probability-weighted assessment approach derived from the likelihood of achieving the earn-out criteria. The fair value of the Company’s contingent liability for current expected credit losses associated with its debt guarantees, as further described below, is estimated based on assumptions of future risk of default and the corresponding level of credit losses at the time of default.
Assets and liabilities measured at fair value on a recurring basis consisted of the following at December 31: | | | | | | | | | | | | | | | | | | | | |
| | | | | | |
| | | | Fair Value |
| (In millions) | Classification | Fair Value Hierarchy | | 2020 | | 2019 |
| Assets | | | | | | |
| Cash flow hedges | Prepaid expenses and other current assets | Level 2 | | $ | 9 | | | $ | 4 | |
| | | | | | |
| Liabilities | | | | | | |
| Contingent consideration | Accounts payable and accrued expenses | Level 3 | | $ | 46 | | | $ | — | |
| Contingent consideration | Other long-term liabilities | Level 3 | | — | | | 1 | |
| Contingent debt guarantee | Other long-term liabilities | Level 3 | | 8 | | | — | |
| | | | | | |
The Company’s senior notes are recorded at amortized cost, but measured at fair value for disclosure purposes. The estimated fair value of senior notes was based on matrix pricing which considers readily observable inputs of comparable securities (Level 2 of the fair value hierarchy). The carrying value of the Company’s term loan credit agreement, revolving credit facility borrowings, foreign lines of credit and debt associated with the receivables securitization agreement approximates fair value as these instruments have variable interest rates and the Company has not experienced any change to its credit ratings (Level 2 of the fair value hierarchy). The estimated fair value of total debt, excluding finance leases and other financing obligations, was $22.5 billion and $22.6 billion at December 31, 2020 and 2019, respectively, and the carrying value was $19.9 billion and $21.5 billion at December 31, 2020 and 2019, respectively. The Company maintains a liability for its non-contingent obligations to perform over the term of its debt guarantee arrangements with the Lending Joint Ventures (see Note 9), which is reported primarily within other long-term liabilities in the consolidated balance sheets. The non-contingent component of the Company’s debt guarantee arrangements is recorded at amortized cost but measured at fair value for disclosure purposes. The carrying value of the Company’s non-contingent liability of $18 million and $26 million approximates the fair value at December 31, 2020 and 2019, respectively (Level 3 of the fair value hierarchy). Such guarantees will be amortized in future periods over the contractual term. In addition, the Company has recorded, in conjunction with the adoption of CECL, a contingent liability ($8 million at December 31, 2020, as reported within other long-term liabilities in the consolidated balance sheet), representing the current expected credit losses to which the Company is exposed. This contingent liability is estimated based on certain financial metrics of the Lending Joint Ventures and historical industry data, which is used to develop assumptions of the likelihood the guaranteed parties will default and the level of credit losses in the event a default occurs (Level 3 of the fair value hierarchy). The Company recognized $13 million,
$7 million and $5 million during the years ended December 31, 2020, 2019 and 2018, respectively, within other income (expense) in its consolidated statements of income related to its release from risk under the non-contingent guarantees as well as a change in the provision of estimated credit losses associated with the indebtedness of the Lending Joint Ventures. The Company has not made any payments under the guarantees, nor has it been called upon to do so.
In addition, certain of the Company’s non-financial assets are measured at fair value on a non-recurring basis, including property and equipment, lease ROU assets, equity securities without a readily determinable fair value, goodwill and other intangible assets, and are subject to fair value adjustment in certain circumstances. Additional information about fair value adjustments recorded on a non-recurring basis during the years ended December 31, 2020 and 2019 is included in Note 17 to the consolidated financial statements.
11. Leases
The Company adopted ASU 2016-02 and its related amendments (collectively known as “ASC 842”) effective January 1, 2019 using the optional transition method in ASU 2018-11. Therefore, the reported results and financial position as of and for the years ended December 31, 2020 and 2019 reflect the application of ASC 842, while the reported results for the year ended December 31, 2018 were not adjusted and continue to be reported under the accounting guidance, ASC 840, Leases, in effect for this prior period.
Company as Lessee
The Company primarily leases office space, data centers and equipment from third parties. The Company determines if a contract is a lease at inception. A contract contains a lease if the contract conveys the right to control the use of an identified asset for a period of time in exchange for consideration. The lease term begins on the commencement date, which is the date the Company takes possession of the asset, and may include options to extend or terminate the lease when it is reasonably certain that the option will be exercised. Many of the Company’s leases contain renewal options for varying periods, which can be exercised at the Company’s sole discretion. Leases are classified as operating or finance leases based on factors such as the lease term, lease payments, and the economic life, fair value and estimated residual value of the asset. Certain leases include options to purchase the leased asset at the end of the lease term, which is assessed as a part of the Company’s lease classification determination. The Company elected the package of practical expedients permitted under the transition guidance within ASU 2016-02 to not reassess prior conclusions related to contracts containing leases, lease classification and initial direct costs. The Company’s leases have remaining lease terms ranging from one month to 17 years.
The Company uses the right-of-use model to account for its leases. ROU assets represent the Company’s right to use an underlying asset for the lease term and lease liabilities represent the Company’s obligation to make lease payments arising from the lease. ROU assets and lease liabilities are recognized on the commencement date based on the present value of lease payments over the lease term. ROU assets are based on the lease liability and are increased by prepaid lease payments and decreased by lease incentives received. For leases where the Company is reasonably certain to exercise a renewal option, such option periods have been included in the determination of the Company’s ROU assets and lease liabilities. Certain leases require the Company to pay taxes, insurance, maintenance and other operating expenses associated with the leased asset. Such amounts are not included in the measurement of the ROU assets and lease liabilities to the extent they are variable in nature. These variable lease costs are recognized as variable lease expenses when incurred. As a practical expedient, lease agreements with lease and non-lease components are accounted for as a single lease component for all asset classes. The Company estimates contingent lease incentives when it is probable that the Company is entitled to the incentive at lease commencement. The Company elected the short-term lease recognition exemption for all leases that qualify. Therefore, leases with an initial term of 12 months or less are not recorded on the balance sheet; instead, lease payments are recognized as lease expense on a straight-line basis over the lease term. The depreciable life of the ROU assets and leasehold improvements are limited by the expected lease term unless the Company is reasonably certain of a transfer of title or purchase option. The Company uses its incremental borrowing rate to discount future lease payments in the calculation of the lease liability and ROU asset based on the information available on the commencement date for each lease. The Company’s leases typically do not provide an implicit rate. The determination of the incremental borrowing rate requires judgment and is determined using the Company’s current unsecured borrowing rate, adjusted for various factors such as collateralization, currency and term to align with the terms of the lease.
Lease Balances | | | | | | | | | | | |
| | | |
| (In millions) | | | |
| December 31, | 2020 | | 2019 |
Assets | | | |
Operating lease assets (1) | $ | 504 | | | $ | 684 | |
Finance lease assets (2) | 267 | | | 235 | |
| Total lease assets | $ | 771 | | | $ | 919 | |
| | | |
| Liabilities | | | |
Current | | | |
Operating lease liabilities (1) | $ | 125 | | | $ | 140 | |
Finance lease liabilities (2) | 104 | | | 78 | |
Noncurrent | | | |
Operating lease liabilities (1) | 471 | | | 603 | |
Finance lease liabilities (2) | 271 | | | 144 | |
| Total lease liabilities | $ | 971 | | | $ | 965 | |
| | | |
(1)Operating lease assets are included within other long-term assets, and operating lease liabilities are included within accounts payable and accrued expenses (current portion) and other long-term liabilities (noncurrent portion) in the consolidated balance sheets.
(2)Finance lease assets are included within property and equipment, net and finance lease liabilities are included within short-term and current maturities of long-term debt (current portion) and long-term debt (noncurrent portion) in the consolidated balance sheets.
Components of Lease Cost | | | | | | | | | | | |
| | | |
| (In millions) | | | |
| Year Ended December 31, | 2020 | | 2019 |
Operating lease cost (1) | $ | 198 | | | $ | 207 | |
Finance lease cost (2) | | | |
Amortization of right-of-use assets | 150 | | | 40 | |
Interest on lease liabilities | 21 | | | 8 | |
Total lease cost | $ | 369 | | | $ | 255 | |
| | | |
(1)Operating lease expense is included within cost of processing and services, cost of product and selling, general and administrative expense, dependent upon the nature and use of the ROU asset, in the consolidated statements of income. Operating lease expense includes approximately $50 million and $56 million of variable lease costs for the years ended December 31, 2020 and 2019, respectively.
(2)Finance lease expense is recorded as depreciation and amortization expense within cost of processing and services, cost of product and selling, general and administrative expense, dependent upon the nature and use of the ROU asset, and interest expense, net in the consolidated statements of income. Finance lease expense includes $62 million of accelerated amortization associated with the termination of certain vendor contracts during the year ended December 31, 2020 (see Note 17).
Rent expense for all operating leases was $118 million during the year ended December 31, 2018.
Supplemental Cash Flow Information | | | | | | | | | | | |
| | | |
| (In millions) | | | |
| Year Ended December 31, | 2020 | | 2019 |
| Cash paid for amounts included in the measurement of lease liabilities: | | | |
| Operating cash flows from operating leases | $ | 155 | | | $ | 139 | |
| Operating cash flows from finance leases | 21 | | | 8 | |
| Financing cash flows from finance leases | 187 | | | 37 | |
| | | |
Right-of-use assets obtained in exchange for lease liabilities: (1) | | | |
| Operating leases | $ | 46 | | | $ | 441 | |
| Finance leases | 399 | | | 288 | |
| | | |
(1)Amounts in 2019 include the right-of-use assets and lease liabilities obtained through the acquisition of First Data.
Lease Term and Discount Rate | | | | | | | | | | | |
| | | |
| December 31, | 2020 | | 2019 |
| Weighted-average remaining lease term: | | | |
| Operating leases | 6 years | | 7 years |
| Finance leases | 4 years | | 3 years |
| Weighted-average discount rate: | | | |
| Operating leases | 2.9 | % | | 3.0 | % |
| Finance leases | 3.5 | % | | 3.5 | % |
| | | |
Maturity of Lease Liabilities Future minimum rental payments on leases with initial non-cancellable lease terms in excess of one year were due as follows at December 31, 2020: | | | | | | | | | | | |
| | | |
| (In millions) | | | |
| Year Ending December 31, | Operating Leases (1) | | Finance Leases (2) |
| 2021 | $ | 136 | | | $ | 107 | |
| 2022 | 120 | | | 103 | |
| 2023 | 103 | | | 98 | |
| 2024 | 86 | | | 71 | |
| 2025 | 66 | | | 28 | |
| Thereafter | 146 | | | 3 | |
| Total lease payments | 657 | | | 410 | |
| Less: Interest | (61) | | | (35) | |
| Present value of lease liabilities | $ | 596 | | | $ | 375 | |
| | | |
(1)Operating lease payments include $6 million related to options to extend lease terms that are reasonably certain of being exercised.
(2)Finance lease payments exclude $30 million of legally binding minimum lease payments for leases signed but not yet commenced. Finance leases that have been signed but not yet commenced are for equipment and will commence in 2021 with lease terms of up to 6 years.
Company as Lessor
The Company owns certain point-of-sale (“POS”) terminal equipment which it leases to merchants. Leases are classified as operating or sales-type leases based on factors such as the lease term, lease payments, and the economic life, fair value and estimated residual value of the asset. The terms of the leases typically range from one month to five years. For operating leases,
the minimum lease payments received are recognized as lease income on a straight-line basis over the lease term and the leased asset is included in property and equipment, net in the consolidated balance sheets and depreciated over its estimated useful life. For sales-type leases, selling profit is recognized at the commencement date of the lease to the extent the fair value of the underlying asset is different from its carrying amount. Selling profit is directly impacted by the Company’s estimate of the amount to be derived from the residual value of the asset at the end of the lease term. The residual value of the asset is computed using various assumptions, including the expected fair value of the underlying asset at the end of the lease term. Unearned income is recognized as interest income over the lease term. For sales-type leases, the Company derecognizes the carrying amount of the underlying leased asset and recognizes a net investment in the leased asset in the consolidated balance sheets. The net investment in a leased asset is computed based on the present value of the minimum lease payments not yet received and the present value of the residual value of the asset.
Components of Lease Income | | | | | | | | | | | |
| | | |
| (In millions) | | | |
| Year Ended December 31, | 2020 | | 2019 |
Sales-type leases: | | | |
Selling profit (1) | $ | 48 | | | $ | 20 | |
Interest income (1) | 76 | | | 33 | |
Operating lease income (2) | 257 | | | 36 | |
| | | |
(1)Selling profit includes $106 million and $48 million recorded within product revenue with a corresponding charge of $58 million and $28 million recorded in cost of product in the consolidated statements of income for the years ended December 31, 2020 and 2019, respectively. Interest income is included within product revenue in the consolidated statements of income.
(2)Operating lease income includes a nominal amount of variable lease income and is included within product revenue in the consolidated statements of income for each of the years ended December 31, 2020 and 2019.
Components of Net Investment in Sales-Type Leases | | | | | | | | | | | |
| | | |
| (In millions) | | | |
| December 31, | 2020 | | 2019 |
Minimum lease payments | $ | 355 | | | $ | 376 | |
Residual values | 23 | | | 34 | |
Less: Unearned interest income | (141) | | | (160) | |
Net investment in leases (1) | $ | 237 | | | $ | 250 | |
| | | |
(1)Net investments in leased assets are included within prepaid expenses and other current assets (current portion) and other long-term assets (noncurrent portion) in the consolidated balance sheets.
Maturities of Future Minimum Lease Payment Receivables
Future minimum lease payments receivable on sales-type leases were as follows at December 31, 2020: | | | | | | | |
| | | |
| (In millions) | | | |
| Year Ending December 31, | | | Sales-Type Leases |
| 2021 | | | $ | 153 | |
| 2022 | | | 114 | |
| 2023 | | | 63 | |
| 2024 | | | 22 | |
| 2025 | | | 3 | |
| Thereafter | | | — | |
| Total minimum lease payments | | | $ | 355 | |
| | | |
Lease Payment Receivables Portfolio
The Company accounts for lease payment receivables in connection with POS terminal equipment as a single portfolio. The Company recognizes an allowance for expected credit losses on lease payment receivables at the commencement date of the lease by considering the term, geography and internal credit risk ratings of such lease. The internal credit risk ratings are established based on lessee specific risk factors, such as FICO score, number of years the lessee has been in business and the nature of the lessee’s industry, which are considered indicators of the likelihood a lessee may default in the future. The established reserve for estimated credit losses on lease payment receivables upon adoption of ASU 2016-13 on January 1, 2020 was $56 million. Such reserve for estimated credit losses at December 31, 2020 was $64 million.
The Company determines delinquency status on lease payment receivables based on the number of calendar days past due. The Company considers lease payments that are 90 days or less past due as performing. Lease payments that are greater than 90 days past due are placed on non-accrual status in which interest income is no longer recognized. Lease payment receivables are fully written off in the period they become delinquent greater than 180 days past due. The amortized cost balance of net investment leases at December 31, 2020 and 2019 was $237 million and $250 million, respectively. Lease payment receivables that were determined to be on non-accrual status were nominal at each of December 31, 2020 and 2019.
12. Debt
The Company’s debt consisted of the following at December 31: | | | | | | | | | | | | | | |
| | | | |
| (In millions) | | 2020 | | 2019 |
| Short-term and current maturities of long-term debt: | | | | |
| Lines of credit | | $ | 144 | | | $ | 150 | |
| Finance lease and other financing obligations | | 240 | | | 137 | |
| Total short-term and current maturities of long-term debt | | $ | 384 | | | $ | 287 | |
| | | | |
| Long-term debt: | | | | |
2.700% senior notes due June 2020 | | $ | — | | | $ | 850 | |
4.750% senior notes due June 2021 | | 400 | | | 400 | |
3.500% senior notes due October 2022 | | 700 | | | 700 | |
3.800% senior notes due October 2023 | | 1,000 | | | 1,000 | |
0.375% senior notes due July 2023 (Euro-denominated) | | 612 | | | 559 | |
2.750% senior notes due July 2024 | | 2,000 | | | 2,000 | |
3.850% senior notes due June 2025 | | 900 | | | 900 | |
2.250% senior notes due July 2025 (British Pound-denominated) | | 709 | | | 687 | |
3.200% senior notes due July 2026 | | 2,000 | | | 2,000 | |
2.250% senior notes due June 2027 | | 1,000 | | | — | |
1.125% senior notes due July 2027 (Euro-denominated) | | 612 | | | 559 | |
4.200% senior notes due October 2028 | | 1,000 | | | 1,000 | |
3.500% senior notes due July 2029 | | 3,000 | | | 3,000 | |
2.650% senior notes due June 2030 | | 1,000 | | | — | |
1.625% senior notes due July 2030 (Euro-denominated) | | 612 | | | 559 | |
3.000% senior notes due July 2031 (British Pound-denominated) | | 709 | | | 687 | |
4.400% senior notes due July 2049 | | 2,000 | | | 2,000 | |
| Receivable securitized loan | | 425 | | | 500 | |
| Term loan facility | | 1,250 | | | 3,950 | |
| Unamortized discount and deferred financing costs | | (155) | | | (160) | |
| Revolving credit facility | | 22 | | | 174 | |
| Finance lease and other financing obligations | | 504 | | | 247 | |
| Total long-term debt | | $ | 20,300 | | | $ | 21,612 | |
Annual maturities of the Company’s total debt were as follows at December 31, 2020: | | | | | |
| |
| (In millions) | |
| Year Ending December 31, | |
| 2021 | $ | 384 | |
| 2022 | 1,323 | |
| 2023 | 2,222 | |
| 2024 | 3,329 | |
| 2025 | 1,643 | |
| Thereafter | 11,938 | |
| Total principal payments | 20,839 | |
| Unamortized discount and deferred financing costs | (155) | |
| Total debt | $ | 20,684 | |
| |
Senior Notes
The Company has outstanding $18.3 billion of various fixed-rate senior notes, as described above. The indentures governing the Company’s senior notes contain covenants that, among other matters, limit (i) the Company’s ability to consolidate or merge with or into, or convey, transfer or lease all or substantially all of its properties and assets to, another person, (ii) the Company’s and certain of its subsidiaries’ ability to create or assume liens, and (iii) the Company’s and certain of its subsidiaries’ ability to engage in sale and leaseback transactions. The Company may, at its option, redeem the senior notes, in whole or, from time to time, in part, at any time prior to the applicable maturity date. Interest on the Company’s U.S. dollar-denominated senior notes is paid semi-annually, while interest on its Euro- and British Pound-denominated senior notes is paid annually. The interest rate applicable to certain of the senior notes is subject to an increase of up to two percent in the event that the credit rating assigned to such notes is downgraded below investment grade.
On May 13, 2020, the Company completed an offering of $2.0 billion of senior notes comprised of $1.0 billion aggregate principal amount of 2.25% senior notes due in June 2027 and $1.0 billion aggregate principal amount of 2.65% senior notes due in June 2030. The senior notes pay interest semi-annually on June 1 and December 1, commencing on December 1, 2020. The indentures governing these senior notes contain covenants that are substantially the same as those set forth in the Company’s senior notes described above. The Company used the net proceeds from these senior notes offerings to repay the outstanding principal balance of $850 million under its 2.7% senior notes due in June 2020 and outstanding borrowings under its amended and restated revolving credit facility totaling $1.1 billion.
On June 24, 2019 and July 1, 2019, the Company completed various offerings of senior notes for the purpose of funding the repayment of certain indebtedness of First Data and its subsidiaries on the closing date of the acquisition (see Note 4). Such offerings consisted of the following: | | | | | | | | | | | | | | | | | |
| | | | | |
| (In millions) | Interest Rates | | Maturities | | Aggregate Principal Amount |
| U.S. dollar denominated senior notes | 2.750% - 4.400% | | July 2024 - 2049 | | $ | 9,000 | |
| Euro denominated senior notes | 0.375% - 1.625% | | July 2023 - 2030 | | € | 1,500 | |
| British Pound denominated senior notes | 2.250% - 3.000% | | July 2025 - 2031 | | £ | 1,050 | |
| | | | | |
The Company used a portion of the net proceeds from the 2019 senior note offerings described above in June 2019 to repay outstanding borrowings totaling $790 million under the Company’s amended and restated revolving credit facility. On July 29, 2019, concurrent with the acquisition of First Data, the Company used the remaining net proceeds from the 2019 senior notes offerings described above, as well as the net proceeds of the term loan facility and a drawing on its revolving credit facility described below, to repay $16.4 billion of existing First Data debt and to pay fees and expenses related to such repayment, the First Data acquisition and related transactions.
At December 31, 2020, the 4.75% senior notes due in June 2021 were classified in the consolidated balance sheet as long-term and within the debt maturity schedule above as maturing in September 2023, the date that the Company’s revolving credit facility expires, as the Company has the intent to refinance this debt on a long-term basis and the ability to do so under its revolving credit facility.
Term Loan Facility
On February 15, 2019, the Company entered into a term loan credit agreement with a syndicate of financial institutions pursuant to which such financial institutions committed to provide the Company with a senior unsecured term loan facility in an aggregate amount of $5.0 billion, consisting of $1.5 billion in commitments to provide loans with a term of three years and $3.5 billion in commitments to provide loans with a term of five years. On July 29, 2019, concurrent with the closing of the acquisition of First Data, the term loan credit agreement was funded. Loans drawn under the term loan facility are subject to amortization at a quarterly rate of 1.25% for the first eight quarters and 1.875% each quarter thereafter (with loans outstanding under the five-year tranche subject to amortization at a quarterly rate of 2.5% after the fourth anniversary of the commencement of amortization), with accrued and unpaid amortization amounts required to be paid on the last business day in December of each year. Borrowings under the term loan facility bear interest at variable rates based on LIBOR or on a base rate, plus in each case, a specified margin based on the Company’s long-term debt rating in effect from time to time. The variable interest rate on the term loan facility borrowings was 1.41% at December 31, 2020. The term loan credit facility contains affirmative, negative and financial covenants, and events of default, that are substantially the same as those set forth in the Company’s existing amended revolving credit facility, as described below.
Revolving Credit Facility
The Company maintains an amended and restated revolving credit facility, which matures in September 2023, with aggregate commitments available for $3.5 billion of total capacity. Borrowings under the amended and restated revolving credit facility bear interest at a variable rate based on LIBOR or a base rate, plus in each case a specified margin based on the Company’s long-term debt rating in effect from time to time. The variable interest rate on the revolving credit facility borrowings was 1.18% at December 31, 2020. There are no significant commitment fees and no compensating balance requirements. The amended and restated revolving credit facility contains various restrictions and covenants that require the Company, among other things, to (i) limit its consolidated indebtedness as of the end of each fiscal quarter to no more than three and one-half times the Company’s consolidated net earnings before interest, taxes, depreciation, amortization, non-cash charges and expenses and certain other adjustments (“EBITDA”) during the period of four fiscal quarters then ended, subject to certain exceptions, and (ii) maintain EBITDA of at least three times its consolidated interest expense as of the end of each fiscal quarter for the period of four fiscal quarters then ended.
On February 6, 2019, the Company entered into an amendment to its amended and restated revolving credit facility to (i) amend the maximum leverage ratio covenant to permit it to elect to increase the permitted maximum leverage ratio from three and one-half times the consolidated EBITDA to either four times or four and one-half times the Company’s consolidated EBITDA for a specified period following certain acquisitions and (ii) permit it to make drawings under the revolving credit facility on the closing date of its acquisition of First Data subject to only limited conditions. In November 2019, the Company elected to increase the permitted maximum leverage ratio to four times the Company’s consolidated EBITDA pursuant to the terms of the amendment described above. The Company was in compliance with all financial debt covenants during 2020.
Foreign Lines of Credit and Other Arrangements
The Company maintains certain short-term lines of credit with foreign banks and alliance partners primarily to fund settlement activity. These arrangements are primarily associated with international operations and are in various functional currencies, the most significant of which are the Australian dollar, Polish zloty, Euro and Argentine peso. The Company had amounts outstanding on these lines of credit totaling $144 million and $150 million at a weighted-average interest rate of 21.98% and 13.42% at December 31, 2020 and 2019, respectively.
Receivable Securitized Loan
The Company maintains a consolidated wholly-owned subsidiary, First Data Receivables, LLC (“FDR”). FDR is a party to certain receivables financing arrangements, including an agreement (“Receivables Financing Agreement”) with certain financial institutions and other persons from time to time party thereto as lenders and group agents, pursuant to which certain wholly-owned subsidiaries of the Company have agreed to transfer and contribute receivables to FDR, and FDR in turn may obtain borrowings from the financial institutions and other lender parties to the Receivables Financing Agreement secured by liens on those receivables. FDR’s assets are not available to satisfy the obligations of any other entities or affiliates of the Company, and FDR’s creditors would be entitled, upon its liquidation, to be satisfied out of FDR’s assets prior to any assets or value in FDR becoming available to the Company. The receivables held by FDR are recorded within trade accounts receivable, net in the Company’s consolidated balance sheets. FDR held $811 million and $773 million in receivables as part of the securitization program at December 31, 2020 and 2019, respectively. FDR utilized the receivables as collateral in borrowings of $425 million and $500 million as of December 31, 2020 and 2019, respectively, at an average interest rate of 1.00% and 2.61%, respectively.
At December 31, 2020, the collateral capacity under the Receivables Financing Agreement was $625 million, and the maximum borrowing capacity was $500 million. The term of the Receivables Financing Agreement is through July 2022.
Deferred Financing Costs
Deferred financing costs are amortized as a component of interest expense, net over the term of the underlying debt using the effective interest method. Deferred financing costs related to the Company’s senior notes, term loan and receivable securitized loan totaled $117 million and $120 million at December 31, 2020 and 2019, respectively, and are reported as a direct reduction of the related debt instrument in the consolidated balance sheets. Deferred financing costs related to the Company’s revolving credit facility are reported in other long-term assets in the consolidated balance sheets and totaled $5 million and $7 million at December 31, 2020 and 2019, respectively.
Debt Financing Activities
On January 16, 2019, in connection with the definitive merger agreement to acquire First Data (see Note 4), the Company entered into a bridge facility commitment letter pursuant to which a group of financial institutions committed to provide a 364-day senior unsecured bridge term loan facility in an aggregate principal amount of $17.0 billion for the purpose of funding the repayment of certain indebtedness of First Data and its subsidiaries on the closing date of the acquisition of First Data, making cash payments in lieu of fractional shares as part of the acquisition consideration and paying fees and expenses related to the acquisition, the refinancing and the related transactions. The Company recorded $98 million of expenses, reported within debt financing activities in the consolidated statements of income, related to the bridge term loan facility during the year ended December 31, 2019. The aggregate commitments of $17.0 billion under the bridge facility commitment letter were replaced with a corresponding amount of permanent financing through the term loan credit agreement and issuance of senior notes, as described above, resulting in the termination of the bridge term loan facility effective July 1, 2019.
In June 2019, the Company entered into foreign exchange forward contracts to minimize foreign currency exposure to the Euro and British Pound upon settlement of the proceeds from the foreign currency-denominated senior notes, as described above. The foreign exchange forward contracts matured on July 1, 2019, concurrent with the closing of the offering of the foreign currency-denominated senior notes. The Company realized foreign currency transaction gains of $3 million, reported within debt financing activities in the consolidated statement of income during the year ended December 31, 2019, from these foreign exchange forward contracts. Further, upon completion of the acquisition of First Data, the Company designated its Euro- and British Pound-denominated senior notes as net investment hedges to hedge a portion of its net investment in certain Euro- and British Pound-denominated subsidiaries (see Note 14). Prior to designating the foreign currency-denominated senior notes as net investment hedges, the Company realized foreign currency transaction gains of $69 million, reported within debt financing activities in the consolidated statement of income during the year ended December 31, 2019, as a result of changes in the U.S. dollar equivalent of the Euro- and British Pound-denominated senior notes due to fluctuations in foreign currency exchange rates. In addition, the Company held a portion of the proceeds from the issuance of these foreign currency-denominated senior notes in Euro- and British Pound-denominated cash and cash equivalents. The Company realized foreign currency transaction losses of $19 million, reported within debt financing activities in the consolidated statement of income during the year ended December 31, 2019, as a result of changes in the U.S. dollar equivalent of the Euro- and British Pound-denominated cash due to fluctuations in foreign currency exchange rates.
In September 2018, the Company completed an offering of $2.0 billion of senior notes comprised of $1.0 billion aggregate principal amount of 3.8% senior notes due in October 2023 and $1.0 billion aggregate principal amount of 4.2% senior notes due in October 2028. The Company used the net proceeds from such offering to repay the outstanding principal balance of $540 million under its then-existing term loan and the then-outstanding borrowings under its amended and restated revolving credit facility totaling $1.1 billion. In addition, the Company commenced a cash tender offer in September 2018 for any and all of its then-outstanding $450 million aggregate principal amount of 4.625% senior notes due October 2020. Upon expiration of the tender offer on September 26, 2018, $246 million was tendered. In October 2018, the Company retired the remaining outstanding $204 million aggregate principal amount of 4.625% senior notes. The Company recorded a pre-tax loss, reported within debt financing activities in the consolidated statements of income, on early debt extinguishment of $14 million during the year ended December 31, 2018 related to these activities.
13. Redeemable Noncontrolling Interests
The Company maintains two redeemable noncontrolling interests which are presented outside of equity and carried at their estimated redemption values. Each minority partner owns 1% of the equity in the joint venture; in addition, each minority partner is entitled to a contractually determined share of the entity’s income. The agreements contain redemption features whereby interests held by the minority partner are redeemable either (i) at the option of the holder or (ii) upon the occurrence of an event that is not solely within the Company’s control. The minority interests have a total estimated redemption value of $259 million at December 31, 2020, which may be terminated by either party for convenience any time after September 1, 2021 and
December 31, 2024, respectively. In the event of termination for cause, as a result of a change in control, or for convenience after the predetermined date, the Company may be required to purchase the minority partner membership interests at a price equal to the fair market value of the minority interest.
The following table presents a summary of the redeemable noncontrolling interests activity during the years ended December 31: | | | | | | | | | | | |
| | | |
| (In millions) | 2020 | | 2019 |
| Balance at beginning of year | $ | 262 | | | $ | — | |
| Acquired First Data interests (see Note 4) | — | | | 252 | |
| Distributions paid to redeemable noncontrolling interests | (42) | | | (7) | |
| Share of income | 39 | | | 17 | |
| Balance at end of year | $ | 259 | | | $ | 262 | |
| | | |
| | | |
| | | |
| | | |
| | | |
14. Accumulated Other Comprehensive Loss
Changes in accumulated other comprehensive loss by component, net of income taxes, consisted of the following: | | | | | | | | | | | | | | | | | | | | | | | | | | |
| | | | | | | | |
| | Year Ended December 31, 2020 |
| (In millions) | | Cash Flow
Hedges | | Foreign
Currency
Translation | | Pension Plans | | Total |
| Balance at December 31, 2019 | | $ | (141) | | | $ | (33) | | | $ | (6) | | | $ | (180) | |
| Other comprehensive (loss) income before reclassifications | | 5 | | | (221) | | | (6) | | | (222) | |
| Amounts reclassified from accumulated other comprehensive loss | | 15 | | | — | | | — | | | 15 | |
| Net current-period other comprehensive (loss) income | | 20 | | | (221) | | | (6) | | | (207) | |
| Balance at December 31, 2020 | | $ | (121) | | | $ | (254) | | | $ | (12) | | | $ | (387) | |
| | | | | | | | |
| | | | | | | | | | | | | | | | | | | | | | | | | | |
| | | | | | | | |
| | Year Ended December 31, 2019 |
| (In millions) | | Cash Flow
Hedges | | Foreign
Currency
Translation | | Pension Plans | | Total |
| Balance at December 31, 2018 | | $ | (16) | | | $ | (49) | | | $ | (2) | | | $ | (67) | |
| Other comprehensive (loss) income before reclassifications | | (134) | | | 16 | | | (4) | | | (122) | |
| Amounts reclassified from accumulated other comprehensive loss | | 9 | | | — | | | — | | | 9 | |
| Net current-period other comprehensive (loss) income | | (125) | | | 16 | | | (4) | | | (113) | |
| | | | | | | | |
| | | | | | | | |
| Balance at December 31, 2019 | | $ | (141) | | | $ | (33) | | | $ | (6) | | | $ | (180) | |
| | | | | | | | |
The Company has entered into forward exchange contracts, which have been designated as cash flow hedges, to hedge foreign currency exposure to the Indian Rupee. The notional amount of these derivatives was $259 million and $178 million, and the fair value totaling $9 million and $4 million is reported primarily in prepaid expenses and other current assets in the consolidated balance sheets at December 31, 2020 and 2019, respectively. Based on the amounts recorded in accumulated other comprehensive loss at December 31, 2020, the Company estimates that it will recognize gains of approximately $8 million in cost of processing and services during the next twelve months as foreign exchange forward contracts settle.In March 2019, the Company entered into treasury lock agreements (“Treasury Locks”), designated as cash flow hedges, in the aggregate notional amount of $5.0 billion to manage exposure to fluctuations in benchmark interest rates in anticipation of the issuance of fixed rate debt in connection with the refinancing of certain indebtedness of First Data and its subsidiaries. In June 2019, concurrent with the issuance of U.S dollar-denominated senior notes (see Note 12), the Treasury Locks were settled
resulting in a payment, included in cash flows from operating activities, of $183 million recorded in accumulated other comprehensive loss, net of income taxes, that will be amortized to earnings over the terms of the originally forecasted interest payments. Based on the amounts recorded in accumulated other comprehensive loss at December 31, 2020, the Company estimates that it will recognize approximately $20 million in interest expense, net during the next twelve months related to settled interest rate hedge contracts.
To reduce exposure to changes in the value of the Company’s net investments in certain of its foreign currency-denominated subsidiaries due to changes in foreign currency exchange rates, the Company uses its foreign currency-denominated debt as an economic hedge of its net investments in such foreign currency-denominated subsidiaries. In conjunction with the acquisition of First Data (see Note 4), the Company designated its Euro- and British Pound-denominated senior notes (see Note 12) as net investment hedges to hedge a portion of its net investment in certain subsidiaries whose functional currencies are the Euro and the British Pound. Accordingly, foreign currency transaction gains or losses on the qualifying net investment hedge instruments are recorded as foreign currency translation within other comprehensive (loss) income in the consolidated statements of comprehensive income and will remain in accumulated other comprehensive loss in the consolidated balance sheets until the sale or complete liquidation of the underlying foreign subsidiaries. The Company recorded a foreign currency translation loss, net of tax, of $151 million and $62 million in other comprehensive (loss) income from the Euro- and British Pound-denominated senior notes during the years ended December 31, 2020 and 2019, respectively.
15. Employee Benefit Plans
Defined Contribution Plans
The Company and its subsidiaries maintain defined contribution savings plans covering the majority of their employees. Under the plans, eligible participants may elect to contribute a specified percentage of their salaries and the Company makes matching contributions, each subject to certain limitations. The plans provide tax-deferred amounts for each participant, consisting of employee elective contributions, company matching and discretionary company contributions. In response to the COVID-19 pandemic, the Company has taken several actions since the onset of the pandemic to manage discretionary costs, including the temporary suspension of certain employee-related benefits such as company matching contributions to the plans during most of 2020. Expenses for company contributions under these plans totaled $38 million, $65 million and $44 million in 2020, 2019 and 2018, respectively. Effective January 1, 2021, company matching contributions were re-established to equal 100% on the first 1% contributed and 25% on the next 4% contributed for eligible participants.
In connection with the acquisition of First Data (see Note 4), the Company assumed defined contribution savings plans and defined contribution pension plans covering substantially all employees of the former First Data. Effective January 1, 2020, the 401(k) Savings Plan of Fiserv, Inc. (the “Plan”) was amended to freeze the Plan to new participants and contributions and to allow for the merger of the Plan into the surviving Fiserv 401(k) Savings Plan (f/k/a the First Data Corporation Incentive Savings Plan) (“New Fiserv Plan”) for the purpose of providing a single plan covering current and former employees of both companies and their affiliates. Participants in the Plan became eligible to make salary reduction contributions in the New Fiserv Plan effective January 1, 2020. The merger of the Plan into the New Fiserv Plan was completed in the third quarter of 2020.
Defined Benefit Plans
The Company maintains noncontributory defined benefit pension plans covering a portion of the employees in the United Kingdom (“U.K.”), the U.S., Germany and Austria. The majority of these plans are frozen and provide benefits to eligible employees based on an employee’s average final compensation and years of service.
The following table provides a reconciliation of benefit obligations, plan assets and the funded status of these defined benefit plans as of and for the years ended December 31: | | | | | | | | | | | | | | | | | | | | | | | | | | |
| | | | | | | | |
| | U.K. plan | | U.S. and other plans |
(In millions) | | 2020 | | 2019 | | 2020 | | 2019 |
| Change in projected benefit obligations: | | | | | | | | |
| Balance at beginning of year | | $ | (672) | | | $ | — | | | $ | (225) | | | $ | — | |
Acquired First Data plans (see Note 4) | | — | | | (687) | | | — | | | (219) | |
| | | | | | | | |
| Interest cost | | (14) | | | (6) | | | (6) | | | (3) | |
| Actuarial gain (loss) | | (93) | | | 28 | | (18) | | | (15) | |
| Benefits paid | | 30 | | | 12 | | 13 | | | 12 | |
| Foreign currency translation | | (28) | | | (19) | | | (2) | | | — | |
| Balance at end of year | | $ | (777) | | | $ | (672) | | | $ | (238) | | | $ | (225) | |
| | | | | | | | |
| Change in fair value of plan assets: | | | | | | | | |
| Balance at beginning of year | | $ | 860 | | | $ | — | | | $ | 167 | | | $ | — | |
Acquired First Data plans (see Note 4) | | — | | | 866 | | — | | | 160 | |
Actual return on plan assets | | 110 | | | (19) | | | 22 | | | 19 | |
| Company contribution | | — | | | — | | | 5 | | | — | |
| Benefits paid | | (30) | | | (12) | | | (13) | | | (12) | |
| Foreign currency translation | | 34 | | | 25 | | — | | | — | |
| Balance at end of year | | $ | 974 | | | $ | 860 | | | $ | 181 | | | $ | 167 | |
| | | | | | | | |
| Funded status of the plans | | $ | 197 | | | $ | 188 | | | $ | (57) | | | $ | (58) | |
| | | | | | | | |
The funded status of the defined benefit plans is recognized as an asset or a liability within other long-term assets or within other long-term liabilities in the consolidated balance sheets. Projected Benefit Obligations
The Company records amounts relating to its defined benefit pension plan obligations and their associated expenses based on calculations which include actuarial assumptions, including the discount rate and the expected rate of return on plan assets. Changes in any of the assumptions and the amortization of differences between the assumptions and actual experience will affect the amount of pension expense in future periods. The Company reviews its actuarial assumptions at least annually and modifies the assumptions based on current rates and trends, as appropriate. The effects of modifications are recognized immediately within the consolidated balance sheets, and are generally amortized to operating income over future periods, with the deferred amount recorded in accumulated other comprehensive loss within the consolidated balance sheets. The Company’s funding policy is to contribute quarterly an amount as recommended by the plans’ independent actuaries. Company contributions under these plans totaled $5 million in 2020 and are expected to be nominal in 2021. The Company employs a building block approach in determining the expected long-term rate of return for plan assets with proper consideration of diversification and re-balancing. Historical markets are studied and long-term historical relationships between equities and fixed-income securities are preserved consistent with the widely accepted capital market principle that assets with higher volatility generate a greater return over the long run. Current market factors such as inflation and interest rates are evaluated before long-term capital market assumptions are determined. Peer data and historical returns are reviewed to check for reasonableness and appropriateness.
The weighted-average rate assumptions used in the measurement of the Company’s projected benefit obligations and net periodic benefit expense as of and for the years ended December 31 were as follows:
| | | | | | | | | | | | | | | | | | | | | | | | | | |
| | | | | | | | |
| | Projected Benefit Obligations | | Net Periodic Benefit Expense |
| | 2020 | | 2019 | | 2020 | | 2019 |
| Discount rate | | 1.56 | % | | 2.28 | % | | 1.95 | % | | 2.16 | % |
| Expected long-term return on plan assets | | n/a | | n/a | | 2.84 | % | | 2.83 | % |
| | | | | | | | |
The estimated future benefit payments are expected to be as follows: | | | | | | | | |
| | |
| (In millions) | | |
| Year Ending December 31, | | |
| 2021 | | $ | 32 | |
| 2022 | | 33 | |
| 2023 | | 36 | |
| 2024 | | 36 | |
| 2025 | | 37 | |
| 2026-2030 | | 200 | |
| | |
Plan Assets The Company’s investment strategy for the U.K. plan is to allocate the assets into two pools: (i) off-risk assets whereby the focus is risk management, protection and insurance relative to the liability target invested in, but not limited to, debt, U.K. government bonds and U.K. government index-linked bonds; and (ii) on-risk assets whereby the focus is on return generation and taking risk in a controlled manner. Such assets could include equities, government bonds, high-yield bonds, property, commodities or hedge funds. The Company’s target allocation for the U.K. plan is 50% on-risk assets and 50% off-risk assets. Investment risk is measured and monitored on an ongoing basis through quarterly investment portfolio reviews, annual liability measurements, and periodic asset and liability studies. The Company’s investment strategy for the U.S. plan employs a total return investment approach whereby a mix of equities and fixed income investments are used to maximize the long-term return of plan assets for a prudent level of risk. The investment portfolio contains a diversified blend of equity and fixed-income investments. The Company sets an allocation mix necessary to support the underlying plan liabilities as influenced significantly by the demographics of the participants and the frozen nature of the plan. The Company’s target allocation for the U.S. plan based on the investment policy at December 31, 2020 was 50% on-risk assets and 50% off-risk assets.
The following table sets forth the Company’s plan assets carried and measured at fair value on a recurring basis at December 31: | | | | | | | | | | | | | | | | | |
| | | | | |
| (In millions) | | | | | |
| 2020 | Level 1 | | Level 2 | | Level 3 |
| Cash and cash equivalents | $ | 24 | | | $ | — | | | $ | — | |
Equity securities (1) | 20 | | | 175 | | | — | |
Fixed income securities (2) | 213 | | | 165 | | | — | |
Other investments (3) | 326 | | | (4) | | | 9 | |
| Total investments at fair value | $ | 583 | | | $ | 336 | | | $ | 9 | |
| | | | | |
| | | | | | | | | | | | | | | | | |
| | | | | |
| (In millions) | | | | | |
| 2019 | Level 1 | | Level 2 | | Level 3 |
| Cash and cash equivalents | $ | 17 | | | $ | — | | | $ | — | |
Equity securities (1) | 134 | | | 123 | | | — | |
Fixed income securities (2) | 188 | | | 214 | | | — | |
Other investments (3) | 315 | | | (22) | | | 10 | |
| Total investments at fair value | $ | 654 | | | $ | 315 | | | $ | 10 | |
| | | | | |
(1)Equity securities primarily consist of domestic, international and global equity pooled funds.
(2)Fixed income securities primarily consist of debt securities issued by U.S. and foreign government agencies and debt obligations issued by a variety of private and public corporations.
(3)Other investments primarily consist of index linked government bonds, derivatives and other investments.
In addition to the investments presented within the fair value hierarchy table above, the Company’s plan assets include investments in various hedge funds that are measured at fair value using the net asset value per share (or its equivalent) practical expedient. Such investments totaled $227 million and $48 million at December 31, 2020 and 2019, respectively.
Net Periodic Benefit Cost
The components of net periodic benefit expense were as follows for the years ended December 31: | | | | | | | | | | | | | | |
| | | | |
| (In millions) | | 2020 | | 2019 |
| | | | |
| Interest cost | | $ | 20 | | | $ | 9 | |
| Expected return on plan assets | | (24) | | | (10) | |
| | | | |
| Net periodic benefit income | | $ | (4) | | | $ | (1) | |
| | | | |
16. Share-Based Compensation
The Company recognizes the fair value of share-based compensation awards granted to employees in cost of processing and services, cost of product, and selling, general and administrative expense in its consolidated statements of income.
The Company’s share-based compensation awards are typically granted in the first quarter of the year and primarily consist of the following:
Stock Options – The Company grants stock options to employees and non-employee directors at exercise prices equal to the fair market value of the Company’s stock on the dates of grant. Stock option grants generally vest over a three- or four-year period. All stock options expire ten years from the date of the award. The Company recognizes compensation expense for the fair value of the stock options over the requisite service period of the stock option award.
Restricted Stock Units and Awards – The Company grants restricted stock units and awards to employees and non-employee directors. Restricted stock unit and award grants generally vest over a three- or four-year period. The Company recognizes compensation expense for restricted stock units and awards based on the market price of the common stock on the grant date over the period during which the units and awards vest.
Performance Share Units and Awards – The Company grants performance share units and awards to employees. The number of shares issued at the end of the performance period is determined by the level of achievement of pre-determined performance and market goals, including earnings, revenue growth, synergy attainment and shareholder return. The Company recognizes compensation expense on performance share units and awards ratably over the requisite three-year performance period of the award to the extent management views the performance goals as probable of attainment. The Company recognizes compensation expense for the fair value of the shareholder return component over the requisite service period of the award.
Employee Stock Purchase Plan – The Company maintains an employee stock purchase plan that allows eligible employees to purchase a limited number of shares of common stock each quarter through payroll deductions at a discount of the closing price of the Company’s common stock on the last business day of each calendar quarter. Effective January 1, 2020, the employee discount under the employee stock purchase plan was modified from 15% to 10%. In addition, the Company temporarily suspended the employee discount, effective April 9, 2020, to help manage discretionary costs in response to the COVID-19 pandemic. Effective January 1, 2021, the discount under the employee stock purchase plan was re-established at 5%, which is considered noncompensatory and therefore does not give rise to recognizable compensation cost.
The Company recognized $369 million, $229 million and $73 million of share-based compensation expense during the years ended December 31, 2020, 2019 and 2018, respectively. At December 31, 2020, the total remaining unrecognized compensation cost for unvested stock options, restricted stock units and awards and performance share units and awards, net of estimated forfeitures, of $276 million is expected to be recognized over a weighted-average period of 2.1 years. During the years ended December 31, 2020, 2019 and 2018, stock options to purchase 2.6 million, 4.7 million and 2.7 million shares, respectively, were exercised.
Acquisition of First Data
Upon the completion of the First Data acquisition on July 29, 2019 (see Note 4), First Data’s equity awards, whether vested or unvested, were either settled in shares of the Company’s common stock or converted into equity awards denominated in shares of the Company’s common stock based on a defined exchange ratio of 0.303, as described below.
First Data time-vesting awards that were granted at or prior to the initial public offering of First Data (the “First Data IPO”) were accelerated in full in accordance with their terms, except for certain executive officer awards and certain awards held by retirement-eligible employees, which were not accelerated and instead converted into equity awards denominated in shares of the Company’s common stock. Each such time-vesting, pre-IPO restricted stock and restricted stock unit award was settled in shares of the Company’s common stock based on the exchange ratio. Each time-vesting, pre-IPO stock option award was converted into an option to purchase a number of shares of the Company’s common stock based on the exchange ratio with an exercise price per share equal to the exercise price per share of such stock option award immediately prior to the completion of the acquisition divided by the exchange ratio.
First Data equity awards granted at the time of the First Data IPO that were subject to vesting solely upon achievement of a $32 price per share of First Data common stock were converted into equity awards denominated in shares of the Company’s common stock and remained eligible to vest upon satisfaction of an adjusted target price per share of the Company’s common stock equal to the existing First Data target price divided by the exchange ratio. Such awards vested during the third quarter of 2019. Each restricted stock and restricted stock unit award that was a performance-vesting IPO award was converted into an award denominated in shares of the Company’s common stock based on the exchange ratio, and each stock option award that was a performance-vesting award was converted into an option to purchase a number of shares of the Company’s common stock based on the exchange ratio with an exercise price per share equal to the exercise price per share of such stock option award immediately prior to the completion of the acquisition divided by the exchange ratio. As converted, the performance-vesting awards continued to be governed by the same terms and conditions as were applicable prior to the acquisition and vested during the year ended December 31, 2019 upon satisfaction of the adjusted performance condition.
The remaining existing First Data equity awards, whether vested or unvested, were converted into equity awards denominated in shares of the Company’s common stock based on the exchange ratio, with an exercise price per share for option awards equal to the exercise price per share of such stock option award immediately prior to the completion of the acquisition divided by the exchange ratio, and will continue to be governed by generally the same terms and conditions as were applicable prior to the acquisition; provided that, subject to compliance with Section 409A of the Internal Revenue Code, such awards will accelerate upon a covered termination as defined in the merger agreement.
The portion of the fair value of the replacement awards related to services provided prior to the acquisition was $768 million and was accounted for as consideration transferred. The remaining portion of the fair value of $467 million is associated with future service and was recognized as compensation expense, net of estimated forfeitures, over the weighted-average remaining vesting period of 1.2 years. The fair value of options that the Company assumed in connection with the acquisition of First Data were estimated using the Black-Scholes model with the following assumptions: | | | | | |
| |
| Expected life (in years) | 2.5 |
| Average risk-free interest rate | 1.9 | % |
| Expected volatility | 27.4 | % |
| Expected dividend yield | 0 | % |
| |
The Company determined the expected life of stock options using a midpoint approach considering the vesting schedule, contractual terms and current option life-to-date. The risk-free interest rate was based on the U.S. treasury yield curve in effect as of the acquisition date. Expected volatility was determined using a weighted-average of the implied volatility and the mean reversion volatility of the Company’s stock at the time of conversion. Share-Based Compensation Activity
The weighted-average estimated fair value of stock options granted during 2020, 2019 and 2018 was $35.02, $28.52 and $22.48 per share, respectively. The fair values of stock options granted were estimated on the date of grant using a binomial option-pricing model with the following assumptions: | | | | | | | | | | | | | | | | | |
| | | | | |
| 2020 | | 2019 | | 2018 |
| Expected life (in years) | 6.4 | | 6.4 | | 6.3 |
| Average risk-free interest rate | 1.8 | % | | 2.7 | % | | 2.2 | % |
| Expected volatility | 28.3 | % | | 28.5 | % | | 28.3 | % |
| Expected dividend yield | 0 | % | | 0 | % | | 0 | % |
| | | | | |
The Company determined the expected life of stock options using historical data. The risk-free interest rate was based on the U.S. treasury yield curve in effect as of the grant date. Expected volatility was determined using weighted-average implied market volatility combined with historical volatility. The Company believes that a blend of historical volatility and implied volatility better reflects future market conditions and better indicates expected volatility than purely historical volatility. A summary of stock option activity is as follows: | | | | | | | | | | | | | | | | | | | | | | | |
| | | | | | | |
| Shares
(In thousands) | | Weighted-
Average
Exercise
Price | | Weighted-
Average
Remaining
Contractual
Term (Years) | | Aggregate
Intrinsic
Value
(In millions) |
| Stock options outstanding - December 31, 2019 | 15,989 | | | $ | 42.83 | | | | | |
| | | | | | | |
| Granted | 1,522 | | | 112.65 | | | | | |
| Forfeited | (186) | | | 93.66 | | | | | |
| Exercised | (2,636) | | | 35.07 | | | | | |
| Stock options outstanding - December 31, 2020 | 14,689 | | | $ | 50.82 | | | 4.60 | | $ | 926 | |
| Stock options exercisable - December 31, 2020 | 12,222 | | | $ | 41.14 | | | 3.79 | | $ | 889 | |
| | | | | | | |
A summary of restricted stock unit and performance share unit activity is as follows: | | | | | | | | | | | | | | | | | | | | | | | | | | |
| | | | | | | | |
| | Restricted Stock Units | | Performance Share Units |
| | Shares
(In thousands) | | Weighted-
Average
Grant Date
Fair Value | | Shares
(In thousands) | | Weighted-
Average
Grant Date
Fair Value |
| Units - December 31, 2019 | | 6,869 | | | $ | 93.80 | | | 2,328 | | | $ | 94.61 | |
| | | | | | | | |
| Granted | | 1,671 | | | 111.27 | | | — | | | — | |
| Forfeited | | (293) | | | 94.33 | | | (28) | | | 90.41 | |
| Vested | | (3,450) | | | 95.86 | | | (479) | | | 92.62 | |
| Units - December 31, 2020 | | 4,797 | | | $ | 98.29 | | | 1,821 | | | $ | 95.20 | |
| | | | | | | | |
A summary of restricted stock award activity is as follows: | | | | | | | | | | | | | | | |
| | | | | | | |
| Restricted Stock Awards | | |
| Shares
(In thousands) | | Weighted-Average Grant Date Fair Value | | | | |
| Awards - December 31, 2019 | 48 | | | $ | 102.30 | | | | | |
| | | | | | | |
| Granted | — | | | — | | | | | |
| Forfeited | — | | | — | | | | | |
| Vested | (48) | | | 102.30 | | | | | |
| Awards - December 31, 2020 | — | | | $ | — | | | | | |
| | | | | | | |
The table below presents additional information related to stock option and restricted stock unit activity: | | | | | | | | | | | | | | | | | | | | |
| | | | | | |
| (In millions) | | 2020 | | 2019 | | 2018 |
| Total intrinsic value of stock options exercised | | $ | 194 | | | $ | 331 | | | $ | 147 | |
| Fair value of restricted stock units vested | | 454 | | | 198 | | | 37 | |
Income tax benefit from stock options exercised and restricted stock units vested | | 156 | | | 126 | | | 43 | |
| Cash received from stock options exercised | | 83 | | | 104 | | | 29 | |
| | | | | | |
At December 31, 2020, 30.5 million share-based awards were available for grant under the Amended and Restated Fiserv, Inc. 2007 Omnibus Incentive Plan. Under its employee stock purchase plan, the Company issued 0.5 million shares in 2020, 0.6 million shares in 2019 and 0.7 million shares in 2018. At December 31, 2020, there were 24.2 million shares available for issuance under the employee stock purchase plan. 17. Restructuring and Other Charges
In connection with the acquisition of First Data, the Company continues to implement integration plans focused on reducing the Company’s overall cost structure, including reducing vendor spend and eliminating duplicate costs. The Company recorded restructuring charges related to certain of these integration activities of $303 million and $56 million, primarily reported in cost of processing and service and selling, general and administrative expenses within the consolidated statements of income, based upon committed actions during the years ended December 31, 2020 and 2019, respectively. The Company continues to evaluate operating efficiencies and anticipates incurring additional costs in connection with these activities, but is unable to estimate those amounts at this time as such plans are not yet finalized.
Employee Termination Costs
The Company recorded $131 million and $32 million of employee termination costs related to severance and other separation costs for terminated employees in connection with the acquisition of First Data during the years ended December 31, 2020 and 2019, respectively. The following table summarizes the changes in the reserve related to the Company’s employee severance and other separation costs during the years ended December 31: | | | | | | | | | | | |
| | | |
| (In millions) | 2020 | | 2019 |
| Balance at beginning of year | $ | 14 | | | $ | — | |
| Severance and other separation costs | 131 | | | 32 | |
| | | |
| Cash payments | (118) | | | (18) | |
| Balance at end of year | $ | 27 | | | $ | 14 | |
| | | |
The employee severance and other separation costs accrual balance of $27 million at December 31, 2020 is expected to be paid within the next twelve months. In addition, the Company recorded $48 million and $23 million of share-based compensation costs during the years ended December 31, 2020 and 2019, respectively, related to the accelerated vesting of equity awards for terminated employees. Facility Exit Costs
The Company has identified certain leased facilities that have been or will be exited in the future as part of the Company’s efforts to reduce facility costs. During 2020, the Company permanently vacated certain of these leased facilities in advance of the non-cancellable lease terms. In conjunction with the exit of these leased facilities, the Company assessed the respective operating lease ROU assets for impairment by comparing the carrying values of the ROU assets to the discounted cash flows from estimated sublease payments (Level 3 of the fair value hierarchy). In addition, the Company assessed certain property and equipment associated with the leased facilities for impairment. As a result, the Company recorded non-cash impairment charges of $124 million, reported in selling, general and administrative expense within the consolidated statement of income during the year ended December 31, 2020, associated with the early exit of these leased facilities. In addition, the Company recorded facility exit and related costs during the year ended December 31, 2019, primarily related to relocation costs and lease exit or termination fees, as well as ongoing operating expenses of certain vacated facilities; however, such costs were not significant.
Other Costs
During 2020, in connection with initiatives to reduce the Company’s overall cost structure following the acquisition of First Data, the Company terminated certain of its existing lease agreements to upgrade and consolidate its computing infrastructure.
The Company upgraded or replaced certain leased hardware under separate, new lease agreements, resulting in the early termination and disposal of existing hardware under the current lease agreements. As such, the Company has adjusted the amortization period for these existing lease agreements to coincide with the modified remaining term. Finance lease expense during the year ended December 31, 2020 includes $62 million of accelerated amortization associated with the termination of these vendor contracts. In addition, the Company executed similar terminations to certain of its existing software financing agreements. Amortization expense during the year ended December 31, 2020 includes $56 million of accelerated amortization associated with the termination of these vendor contracts.
During 2019, the Company recorded a $48 million non-cash impairment charge, reported primarily in cost of processing and services within the consolidated statements of income, associated with an international core account processing platform. Such impairment charge primarily related to the write-off of certain of the Fintech segment’s purchased and capitalized software development costs; however, are presented within Corporate and Other as such charge was excluded from the Company’s measure of the Fintech segment’s operating performance.
18. Income Taxes
Substantially all of the Company’s pre-tax earnings are derived from domestic operations in all periods presented. The income tax provision was as follows for the years ended December 31: | | | | | | | | | | | | | | | | | |
| | | | | |
| (In millions) | 2020 | | 2019 | | 2018 |
| Components of income tax provision (benefit): | | | | | |
| Current: | | | | | |
| Federal | $ | (25) | | | $ | 25 | | | $ | 189 | |
| State | 71 | | | 69 | | | 39 | |
| Foreign | 79 | | | 57 | | | 17 | |
| 125 | | | 151 | | | 245 | |
| Deferred: | | | | | |
| Federal | 189 | | | 118 | | | 110 | |
| State | (34) | | | (18) | | | 24 | |
| Foreign | (84) | | | (53) | | | (1) | |
| 71 | | | 47 | | | 133 | |
| Income tax provision | $ | 196 | | | $ | 198 | | | $ | 378 | |
| | | | | |
| | | | | |
| | | | | |
A reconciliation of the statutory federal income tax rate to the Company’s effective income tax rate is as follows for the years ended December 31: | | | | | | | | | | | | | | | | | |
| | | | | |
| 2020 | | 2019 | | 2018 |
| Statutory federal income tax rate | 21.0 | % | | 21.0 | % | | 21.0 | % |
| State income taxes, net of federal effect | 2.0 | % | | 3.7 | % | | 3.2 | % |
| | | | | |
| Tax expense due to federal tax reform | — | % | | — | % | | 1.2 | % |
| | | | | |
| Enacted United Kingdom tax rate change | 2.8 | % | | — | % | | — | % |
| Foreign derived intangibles income deduction | (3.2) | % | | (0.2) | % | | (0.2) | % |
| Excess tax benefit from share-based awards | (3.9) | % | | (5.1) | % | | (2.2) | % |
| Sale of businesses and subsidiary restructuring | 0.7 | % | | (2.6) | % | | 1.3 | % |
| | | | | |
| Unrecognized tax benefits | (1.0) | % | | (0.1) | % | | — | % |
| Nondeductible executive compensation | 2.0 | % | | 1.0 | % | | 0.2 | % |
| Valuation Allowance | (1.7) | % | | 0.3 | % | | — | % |
| Other, net | (2.0) | % | | 0.3 | % | | (0.2) | % |
| Effective income tax rate | 16.7 | % | | 18.3 | % | | 24.3 | % |
| | | | | |
Significant components of deferred tax assets and liabilities consisted of the following at December 31: | | | | | | | | | | | |
| | | |
| (In millions) | 2020 | | 2019 |
| Accrued expenses | $ | 189 | | | $ | 303 | |
| | | |
| Share-based compensation | 185 | | | 216 | |
| Net operating loss and credit carry-forwards | 1,158 | | | 1,444 | |
| Foreign tax credits on undistributed earnings | — | | | 289 | |
| Leasing liabilities | 171 | | | 219 | |
| Other | 76 | | | 65 | |
| Subtotal | 1,779 | | | 2,536 | |
| Valuation allowance | (888) | | | (1,145) | |
| Total deferred tax assets | 891 | | | 1,391 | |
| | | |
| Capitalized software development costs | (614) | | | (622) | |
| Intangible assets | (2,993) | | | (3,297) | |
| Property and equipment | (198) | | | (143) | |
| Capitalized commissions | (87) | | | (86) | |
| Investments in joint ventures | (908) | | | (841) | |
| Leasing right-of-use assets | (141) | | | (205) | |
| | | |
| Other | (311) | | | (332) | |
| Total deferred tax liabilities | (5,252) | | | (5,526) | |
| Total | $ | (4,361) | | | $ | (4,135) | |
| | | |
In connection with the acquisition of First Data (see Note 4), the Company recorded $3.7 billion of deferred tax liabilities for the deferred tax effects associated with the fair value of assets acquired and liabilities assumed using the applicable tax rates, with a corresponding adjustment to goodwill. During the current year through the measurement period ended July 29, 2020, the Company recognized an incremental increase of $136 million to deferred tax liabilities related to measurement period adjustments, with a corresponding adjustment to goodwill. The measurement period adjustments to the preliminary First Data purchase price allocation were the result of additional analysis performed and information identified based on facts and circumstances that existed as of the acquisition date. The Company recorded a valuation allowance of $888 million and $1.1 billion at December 31, 2020 and 2019, respectively, against its deferred tax assets. The decrease in the valuation allowance in 2020 is primarily the result of a subsidiary restructuring. Substantially all of the acquired First Data valuation allowance relates to certain foreign and state net operating loss carryforwards.
Deferred tax assets and liabilities are reported in the consolidated balance sheets as follows at December 31: | | | | | | | | | | | |
| | | |
| (In millions) | 2020 | | 2019 |
| Noncurrent assets | $ | 28 | | | $ | 112 | |
| Noncurrent liabilities | (4,389) | | | (4,247) | |
| Total | $ | (4,361) | | | $ | (4,135) | |
| | | |
Noncurrent deferred tax assets are included in other long-term assets in the consolidated balance sheets at December 31, 2020 and 2019.
The following table presents the amounts of federal, state and foreign net operating loss carryforwards and general business credit carryforwards at December 31: | | | | | | | | | | | |
| | | |
| (In millions) | 2020 | | 2019 |
Net operating loss carryforwards: (1) | | | |
| Federal | $ | 443 | | | $ | 1,674 | |
| State | 3,944 | | | 4,636 | |
| Foreign | 3,343 | | | 3,201 | |
General business credit carryforwards (2) | 41 | | | 57 | |
| | | |
(1)At December 31, 2020, the Company had federal net operating loss carryforwards of $443 million, most of which expire in 2021 through 2037, state net operating loss carryforwards of $3.9 billion, most of which expire in 2021 through 2040, and foreign net operating loss carryforwards of $3.3 billion, of which $263 million expire in 2021 through 2040, and the remainder of which do not expire.
(2)At December 31, 2020, the Company had general business credit carryforwards of $41 million which expire in 2025 through 2038.
The Company asserts that its investment in its foreign subsidiaries is intended to be indefinitely reinvested with limited exceptions for select foreign subsidiaries. Undistributed historical and future earnings of its foreign subsidiaries are not considered to be indefinitely reinvested. Should these earnings be distributed in the future in the form of dividends or otherwise, the Company may be subject to foreign taxes. The Company has the ability and intent to limit distributions so as to not make a distribution in excess of its investment in those subsidiaries. The Company will continue to monitor its global cash requirements and the need to recognize a deferred tax liability.
Unrecognized tax benefits were as follows at December 31: | | | | | | | | | | | | | | | | | |
| | | | | |
| (In millions) | 2020 | | 2019 | | 2018 |
| Unrecognized tax benefits - Beginning of year | $ | 145 | | | $ | 49 | | | $ | 42 | |
| Increases for assumed tax positions related to First Data | — | | | 82 | | | — | |
| Increases for tax positions taken during the current year | 9 | | | 8 | | | 3 | |
| Increases for tax positions taken in prior years | 53 | | | 16 | | | 20 | |
| Decreases for tax positions taken in prior years | (23) | | | (2) | | | (8) | |
| Decreases for settlements | (2) | | | (1) | | | — | |
| Lapse of the statute of limitations | (11) | | | (7) | | | (8) | |
| Unrecognized tax benefits - End of year | $ | 171 | | | $ | 145 | | | $ | 49 | |
| | | | | |
At December 31, 2020, unrecognized tax benefits of $116 million, net of federal and state benefits, would affect the effective income tax rate if recognized. The Company believes it is reasonably possible that the liability for unrecognized tax benefits may decrease by up to $61 million over the next twelve months as a result of possible closure of federal tax audits, potential settlements with certain states and foreign countries, and the lapse of the statute of limitations in various state and foreign jurisdictions. The Company classifies interest expense and penalties related to income taxes as components of its income tax provision. The income tax provision included interest expense and penalties on unrecognized tax benefits of $3 million in 2020, $2 million in 2019 and $1 million in 2018. Accrued interest expense and penalties related to unrecognized tax benefits totaled $22 million and $19 million at December 31, 2020 and 2019, respectively.
The Company’s U.S. federal income tax returns for 2016 through 2020, and tax returns in certain states and foreign jurisdictions for 2005 through 2020, remain subject to examination by taxing authorities. In connection with the acquisition of First Data, the Company is subject to income tax examination from 2009 forward in relation to First Data’s U.S. federal income tax return. State and local examinations are substantially complete through 2010 in relation to First Data’s state and local tax filings. Foreign jurisdictions generally remain subject to examination by their respective authorities from 2010 forward in relation to First Data’s foreign tax filings, none of which are considered significant jurisdictions.
During the third quarter of 2020, the U.S. Department of Treasury released certain proposed and final regulations relating to provisions that were enacted under the Tax Cuts and Jobs Act of 2017. The new regulations did not have a material impact on the Company’s consolidated financial statements.
The Company accounts for research and development costs in accordance with ASC subtopic 730-10, Research and Development (“ASC 730-10”). Under ASC 730-10, all research and development costs are charged to expense as incurred. Company-sponsored research and development costs related to both present and future products are expensed in the period incurred. In September 2017, the Internal Revenue Service issued Directive LB&I-04-0917-005 pertaining to the allowance of the credit for increasing research activities under Internal Revenue Code section 41 allowing a safe harbor for LB&I taxpayers reporting research and development costs under ASC 730-10. During the year ended December 31, 2020, the Company incurred $150 million of research and development costs related to First Data.
19. Commitments and Contingencies
Litigation
In the normal course of business, the Company or its subsidiaries are named as defendants in lawsuits in which claims are asserted against the Company. In addition, the Company assumed certain legal proceedings in connection with the acquisition of First Data (see Note 4) primarily associated with its merchant business including claims associated with alleged processing errors and a tax matter. In 2020, the Company resolved a matter with the Federal Trade Commission related to a U.S.-based wholesale independent sales organization resulting in a payment of $40 million, for which the Company previously had accrued. The Company maintained reserves of $32 million and $43 million at December 31, 2020 and 2019, respectively, related to its various legal proceedings, primarily associated with the Company’s merchant business as described above. The Company’s estimate of the possible range of exposure for various litigation matters in excess of amounts accrued is $0 million to approximately $60 million. In the opinion of management, the liabilities, if any, which may ultimately result from such lawsuits are not expected to have a material adverse effect on the Company’s consolidated financial statements.
Electronic Payments Transactions
In connection with the Company’s processing of electronic payments transactions, funds received from subscribers are invested from the time the Company collects the funds until payments are made to the applicable recipients. These subscriber funds are invested in short-term, highly liquid investments. Subscriber funds, which are not included in the Company’s consolidated balance sheets, can fluctuate significantly based on consumer bill payment and debit card activity and totaled approximately $1.7 billion and $2.0 billion at December 31, 2020 and 2019, respectively.
Indemnifications and Warranties
The Company may indemnify its clients from certain costs resulting from claims of patent, copyright or trademark infringement associated with its clients’ use of the Company’s products or services. The Company may also warrant to clients that its products and services will operate substantially in accordance with identified specifications. From time to time, in connection with sales of businesses, the Company agrees to indemnify the buyers of such businesses for liabilities associated with the businesses that are sold. Payments, net of recoveries, under such indemnification or warranty provisions were not material to the Company’s consolidated results of operations or financial position.
20. Related Party Transactions
Merchant Alliances
A significant portion of the Company’s business is conducted through merchant alliances between the Company and financial institutions (see Note 9). To the extent the Company maintains a controlling financial interest in an alliance, the alliance’s financial statements are consolidated with those of the Company and the related processing fees are treated as an intercompany transaction and eliminated in consolidation. To the extent the Company has significant influence but not control in an alliance, the Company uses the equity method of accounting to account for its investment in the alliance. As a result, the Company’s consolidated revenues include processing fees, administrative service fees, and other fees charged to alliances accounted for under the equity method. Such fees totaled $183 million and $76 million for the years ended December 31, 2020 and 2019, respectively. No directors or officers of the Company have ownership interests in any of the alliances. The formation of each of these alliances generally involves the Company and the bank contributing contractual merchant relationships to the alliance and a cash payment from one owner to the other to achieve the desired ownership percentage for each. The Company and the bank enter into a long-term processing service agreement as part of the negotiation process. This agreement governs the Company’s provision of transaction processing services to the alliance. At December 31, 2020 and 2019, the Company had approximately $37 million and $35 million, respectively, of amounts due from unconsolidated merchant alliances included within trade accounts receivable, net in the Company’s consolidated balance sheets.
Effective July 1, 2020, the Company and Bank of America dissolved their BAMS joint venture, of which the Company maintained a 51% controlling ownership interest. Upon dissolution of the joint venture’s operations, the joint venture transferred a proportionate share of value, primarily the client contracts, to each party via an agreed upon contractual separation.
The revenues and expenses of the BAMS joint venture were consolidated into the Company’s financial results through the date of dissolution. See Note 4 for additional information.
Joint Venture Transition Services Agreements
Pursuant to certain transition services agreements, the Company provides, at fair value, various administration, business process outsourcing, and technical and data center related services for defined periods to the Lending Joint Ventures and Tegra 118 (see Note 4). Amounts transacted through these agreements totaled $58 million, $36 million and $30 million during the years ended December 31, 2020, 2019 and 2018, respectively, and were primarily recognized as processing and services revenue in the Company’s consolidated statements of income.
Share Repurchase
On December 14, 2020, New Omaha Holdings L.P. (“New Omaha”), a shareholder of the Company, completed an underwritten secondary public offering of 20.1 million shares of Fiserv, Inc. common stock (the “offering”). The Company did not sell any shares in, nor did it receive any proceeds from, the offering. New Omaha received all of the net proceeds from the offering. In connection with the offering, the Company repurchased from the underwriters 1.8 million shares of its common stock that were subject to the offering, at a price equal to the price per share paid by the underwriters to New Omaha in the offering (the “share repurchase”). The share repurchase totaled $200 million and was funded with cash on hand. The repurchased shares were cancelled and no longer outstanding following the completion of the share repurchase. Prior to the offering, New Omaha owned approximately 16% of the Company’s outstanding shares of common stock, and following the offering, New Omaha owned approximately 13% as of December 31, 2020.
21. Business Segment Information
Following the Segment Realignment (see Note 1), the Company’s operations are comprised of the Acceptance segment, the Fintech segment and the Payments segment.
The businesses in the Acceptance segment provide a wide range of commerce-enabling solutions to merchants of all sizes around the world. These solutions include point-of-sale merchant acquiring and digital commerce services; mobile payment services; security and fraud protection products; CaratSM, the Company’s omnichannel commerce ecosystem; and the Company’s cloud-based Clover point-of-sale platform, which includes a marketplace for proprietary and third-party business applications. The products and services in the global Acceptance businesses are distributed through a variety of channels, including through direct sales teams, strategic partnerships with agent sales forces, independent software vendors, financial institutions and other strategic partners in the form of joint venture alliances, revenue sharing alliances and referral agreements. Many merchants, financial institutions and distribution partners within the Acceptance segment are also clients of the Company’s other segments.
The businesses in the Fintech segment provide financial institutions around the world with the technology solutions they need to run their operations, including products and services that enable financial institutions to process customer deposit and loan accounts, as well as management of an institution’s general ledger and central information files. As a complement to the core account processing functionality, the businesses in the global Fintech segment also provide digital banking, financial and risk management, cash management, professional services and consulting, item processing and source capture, and other products and services that support numerous types of financial transactions. In addition, some of the businesses in the Fintech segment provide products or services to corporate clients to facilitate the management of financial processes and transactions. Many of the products and services offered in the Fintech segment are integrated with solutions from the Company’s other segments.
The businesses in the Payments segment provide financial institutions and corporate clients around the world with the products and services required to process digital payment transactions. This includes card transactions such as debit, credit and prepaid card processing and services, a range of network services, security and fraud protection products, card production and print services. In addition, the Payments segment businesses offer non-card digital payment software and services, including bill payment, account-to-account transfers, person-to-person payments, electronic billing, and security and fraud protection products. Clients of the global Payments segment businesses reflect a wide range of industries, including merchants, distribution partners and financial institution customers in the Company’s other segments.
Corporate and Other supports the reportable segments described above, and consists of amortization of acquisition-related intangible assets, unallocated corporate expenses and other activities that are not considered when management evaluates segment performance, such as gains or losses on sales of businesses, costs associated with acquisition and divestiture activity, and the Company’s Output Solutions postage reimbursements. Corporate and Other also includes the historical results of the Company’s Investment Services business, of which the Company sold a 60% controlling interest in February 2020 (see Note 4), as well as certain transition services revenue associated with various dispositions.
Operating results for each segment are presented below and include the results of First Data from July 29, 2019, the date of acquisition. Segment results for the years ended December 31, 2019 and 2018 have been restated to reflect the Segment Realignment. | | | | | | | | | | | | | | | | | | | | | | | | | | | | | |
| | | | | | | | | |
| (In millions) | Acceptance | | Fintech | | Payments | | Corporate
and Other | | Total |
| 2020 | | | | | | | | | |
| Processing and services revenue | $ | 4,736 | | | $ | 2,714 | | | $ | 4,702 | | | $ | 63 | | | $ | 12,215 | |
| Product revenue | 786 | | | 187 | | | 802 | | | 862 | | | 2,637 | |
| Total revenue | 5,522 | | | 2,901 | | | 5,504 | | | 925 | | | 14,852 | |
Operating income (loss) (1) | 1,427 | | | 992 | | | 2,361 | | | (2,928) | | | 1,852 | |
Capital expenditures, including capitalized software and other intangibles | 227 | | | 183 | | | 242 | | | 248 | | | 900 | |
| Depreciation and amortization expense | 239 | | | 202 | | | 248 | | | 2,568 | | | 3,257 | |
| | | | | | | | | |
| 2019 | | | | | | | | | |
| Processing and services revenue | $ | 2,215 | | | $ | 2,737 | | | $ | 3,431 | | | $ | 190 | | | $ | 8,573 | |
| Product revenue | 356 | | | 205 | | | 478 | | | 575 | | | 1,614 | |
| Total revenue | 2,571 | | | 2,942 | | | 3,909 | | | 765 | | | 10,187 | |
| Operating income (loss) | 764 | | | 885 | | | 1,658 | | | (1,698) | | | 1,609 | |
| Capital expenditures, including capitalized software and other intangibles | 147 | | | 182 | | | 196 | | | 196 | | | 721 | |
| Depreciation and amortization expense | 146 | | | 191 | | | 204 | | | 1,237 | | | 1,778 | |
| | | | | | | | | |
| 2018 | | | | | | | | | |
| Processing and services revenue | $ | — | | | $ | 2,692 | | | $ | 2,101 | | | $ | 182 | | | $ | 4,975 | |
| Product revenue | — | | | 225 | | | 307 | | | 316 | | | 848 | |
| Total revenue | — | | | 2,917 | | | 2,408 | | | 498 | | | 5,823 | |
Operating income (loss) (1) | — | | | 851 | | | 1,081 | | | (179) | | | 1,753 | |
| Capital expenditures, including capitalized software and other intangibles | — | | | 153 | | | 67 | | | 140 | | | 360 | |
| Depreciation and amortization expense | — | | | 185 | | | 81 | | | 290 | | | 556 | |
| | | | | | | | | |
(1)Corporate and Other includes gains of $428 million from the sale of a 60% interest of the Company’s Investment Services business and $36 million on the dissolution of BAMS in 2020, as well as a gain of $227 million from the sale of a 55% interest of the Company’s Lending Solutions business in 2018.
22. Quarterly Financial Data (unaudited)
Quarterly financial data for 2020 and 2019 was as follows: | | | | | | | | | | | | | | | | | | | | | | | | | | | | | |
| | | | | | | | | |
| (In millions, except per share data) | First
Quarter | | Second
Quarter | | Third
Quarter | | Fourth
Quarter | | Full
Year |
| 2020 | | | | | | | | | |
| Total revenue | $ | 3,769 | | | $ | 3,465 | | | $ | 3,786 | | | $ | 3,832 | | | $ | 14,852 | |
| Cost of processing and services | 1,635 | | | 1,466 | | | 1,387 | | | 1,353 | | | 5,841 | |
| Cost of product | 532 | | | 454 | | | 481 | | | 504 | | | 1,971 | |
| Selling, general and administrative expenses | 1,404 | | | 1,377 | | | 1,412 | | | 1,459 | | | 5,652 | |
| (Gain) loss on sale of businesses | (431) | | | 3 | | | (36) | | | — | | | (464) | |
| Total expenses | 3,140 | | | 3,300 | | | 3,244 | | | 3,316 | | | 13,000 | |
| Operating income | 629 | | | 165 | | | 542 | | | 516 | | | 1,852 | |
| Net income | 377 | | | 9 | | | 276 | | | 313 | | | 975 | |
| Net income attributable to Fiserv, Inc. | 392 | | | 2 | | | 264 | | | 300 | | | 958 | |
| Comprehensive (loss) income attributable to Fiserv, Inc. | (239) | | | 169 | | | 77 | | | 744 | | | 751 | |
Net income attributable to Fiserv, Inc. per share: (1) | | | | | | | | | |
| Basic | $ | 0.58 | | | $ | — | | | $ | 0.39 | | | $ | 0.45 | | | $ | 1.42 | |
| Diluted | $ | 0.57 | | | $ | — | | | $ | 0.39 | | | $ | 0.44 | | | $ | 1.40 | |
| | | | | | | | | |
2019 (2) | | | | | | | | | |
| Total revenue | $ | 1,502 | | | $ | 1,512 | | | $ | 3,128 | | | $ | 4,045 | | | $ | 10,187 | |
| Cost of processing and services | 624 | | | 617 | | | 1,204 | | | 1,571 | | | 4,016 | |
| Cost of product | 174 | | | 168 | | | 413 | | | 538 | | | 1,293 | |
| Selling, general and administrative expenses | 341 | | | 343 | | | 1,137 | | | 1,463 | | | 3,284 | |
| Gain on sale of businesses | (10) | | | — | | | — | | | (5) | | | (15) | |
| Total expenses | 1,129 | | | 1,128 | | | 2,754 | | | 3,567 | | | 8,578 | |
| Operating income | 373 | | | 384 | | | 374 | | | 478 | | | 1,609 | |
| Net income | 225 | | | 223 | | | 225 | | | 241 | | | 914 | |
| Net income attributable to Fiserv, Inc. | 225 | | | 223 | | | 198 | | | 247 | | | 893 | |
| Comprehensive income attributable to Fiserv, Inc. | 207 | | | 115 | | | 12 | | | 446 | | | 780 | |
Net income attributable to Fiserv, Inc. per share: (1) | | | | | | | | | |
| Basic | $ | 0.58 | | | $ | 0.57 | | | $ | 0.34 | | | $ | 0.36 | | | $ | 1.74 | |
| Diluted | $ | 0.56 | | | $ | 0.56 | | | $ | 0.33 | | | $ | 0.36 | | | $ | 1.71 | |
| | | | | | | | | |
(1)Net income attributable to Fiserv, Inc. per share in each period is calculated using actual, unrounded amounts.
(2)Includes the results of First Data from July 29, 2019, the date of acquisition.
Fiserv, Inc.
Schedule II — Valuation and Qualifying Accounts
(In millions)
| | | | | | | | | | | | | | | | | | | | | | | | | | | | | | | | |
| | | | | | | | | | |
| | | | Additions | | | | |
| Description | | Balance at Beginning of Period | | Charged to Costs and Expenses | | Charged to Other Accounts | | Deductions | | Balance at End of Period |
| Year ended December 31, 2020 | | | | | | | | | | |
| Deferred tax asset valuation allowance | | $ | 1,145 | | | 6 | | | 64 | | | (327) | | (2) | $ | 888 | |
| Year ended December 31, 2019 | | | | | | | | | | |
Deferred tax asset valuation allowance (1) | | $ | 101 | | | 8 | | | 1,036 | | | — | | | $ | 1,145 | |
| Year ended December 31, 2018 | | | | | | | | | | |
| Deferred tax asset valuation allowance | | $ | 103 | | | 1 | | | (3) | | | — | | | $ | 101 | |
| | | | | | | | | | |
(1)Includes the valuation allowance adjustment associated with the acquisition of First Data.
(2)The decrease in the deferred tax asset valuation allowance is primarily due to a subsidiary restructuring.
REPORT OF INDEPENDENT REGISTERED PUBLIC ACCOUNTING FIRM
To the shareholders and the Board of Directors of Fiserv, Inc:
Opinion on the Financial Statements
We have audited the accompanying consolidated balance sheets of Fiserv, Inc. and subsidiaries (the “Company”) as of December 31, 2020 and 2019, the related consolidated statements of income, comprehensive income, equity, and cash flows, for each of the three years in the period ended December 31, 2020, and the related notes and the schedule listed in Item 15 (collectively referred to as the “financial statements”). In our opinion, the financial statements present fairly, in all material respects, the financial position of the Company as of December 31, 2020 and 2019, and the results of its operations and its cash flows for each of the three years in the period ended December 31, 2020, in conformity with accounting principles generally accepted in the United States of America.
We have also audited, in accordance with the standards of the Public Company Accounting Oversight Board (United States) (PCAOB), the Company’s internal control over financial reporting as of December 31, 2020, based on criteria established in Internal Control – Integrated Framework (2013) issued by the Committee of Sponsoring Organizations of the Treadway Commission and our report dated February 26, 2021, expressed an unqualified opinion on the Company’s internal control over financial reporting.
Change in Accounting Principle
As discussed in Note 2 to the financial statements, the Company has changed its method of accounting for leases as of January 1, 2019 due to the adoption of Accounting Standards Update No. 2016-02, Leases (Topic 842) using the modified retrospective method.
Basis for Opinion
These financial statements are the responsibility of the Company's management. Our responsibility is to express an opinion on the Company's financial statements based on our audits. We are a public accounting firm registered with the PCAOB and are required to be independent with respect to the Company in accordance with the U.S. federal securities laws and the applicable rules and regulations of the Securities and Exchange Commission and the PCAOB.
We conducted our audits in accordance with the standards of the PCAOB. Those standards require that we plan and perform the audit to obtain reasonable assurance about whether the financial statements are free of material misstatement, whether due to error or fraud. Our audits included performing procedures to assess the risks of material misstatement of the financial statements, whether due to error or fraud, and performing procedures that respond to those risks. Such procedures included examining, on a test basis, evidence regarding the amounts and disclosures in the financial statements. Our audits also included evaluating the accounting principles used and significant estimates made by management, as well as evaluating the overall presentation of the financial statements. We believe that our audits provide a reasonable basis for our opinion.
Critical Audit Matters
The critical audit matters communicated below are matters arising from the current-period audit of the financial statements that were communicated or required to be communicated to the audit committee and that (1) relate to accounts or disclosures that are material to the financial statements and (2) involved our especially challenging, subjective, or complex judgments. The communication of critical audit matters does not alter in any way our opinion on the financial statements, taken as a whole, and we are not, by communicating the critical audit matters below, providing separate opinions on the critical audit matters or on the accounts or disclosures to which they relate.
Revenue – Refer to Note 3 to the consolidated financial statements
Critical Audit Matter Description
The Company generates revenue from the delivery of processing, service and product solutions. Revenue is measured based on consideration specified in a contract with a customer, and the Company recognizes revenue when it satisfies a performance obligation by transferring control over a product or service to a customer, which may be at a point in time or over time. The Company’s revenue consists of a significant volume of transactions sourced from multiple systems and applications. The processing of such transactions and recording of revenue is system-driven and based on contractual terms with customers. In addition, contract modifications occur when the Company and its customers agree to modify existing customer contracts to
change the scope or price (or both) of the contract. Contract modifications also occur when a customer terminates some, or all, of the existing services provided by the Company, which may result in the customer paying a termination fee to the Company based upon the terms in the initial contract. When a contract modification occurs, it requires the Company to exercise judgment to determine if the modification should be accounted for as: (i) a separate contract, (ii) the termination of the original contract and creation of a new contract, or (iii) a cumulative catch up adjustment to the original contract. Further, contract modifications require the identification and evaluation of the performance obligations of the modified contract, including the allocation of consideration to the remaining performance obligations and the period of recognition for each identified performance obligation.
We identified the complexity of revenue processing and revenue recognition, including customer contract modifications, as a critical audit matter because of the increased extent of effort and involvement of professionals in our firm having expertise in information technology (IT) to identify, test, and evaluate the Company’s systems and automated controls and the management judgments necessary to determine the appropriate accounting. This required an increased extent of effort and a high degree of auditor judgment when performing audit procedures to evaluate whether revenue transactions were recognized appropriately.
How the Critical Audit Matter Was Addressed in the Audit
Our audit procedures related to revenue recognition included the following, among others:
•We evaluated management’s significant accounting policies.
•We tested internal controls within the relevant revenue business processes, including those in place to reconcile the various reports extracted from the IT systems to the Company’s general ledger and those related to the Company’s accounting for contract modifications.
•With the assistance of professionals in our firm having expertise in IT, we:
◦Identified the relevant systems used to process revenue transactions and tested the general IT controls over each of these systems, including testing of user access controls, change management controls, and IT operations controls.
◦Tested system interface controls and automated controls within the relevant revenue streams, as well as the controls designed to assess the accuracy and completeness of revenue.
•We developed expectations of revenue at a disaggregated level based on historical transaction prices and current year volumes. We compared those estimates to revenue recognized by the Company.
•For a sample of revenue transactions, we tested selected transactions by agreeing the amounts of revenue recognized to source documents and testing the mathematical accuracy of the recorded revenue.
•We selected a sample of significant customer contract modifications and performed the following procedures:
◦Obtained and read the customer contracts.
◦Evaluated whether the contract represented a new contract or a contract modification and, if applicable, assessed the treatment of any change in scope or price.
◦Tested management’s identification of remaining performance obligations.
◦Recalculated the transaction price and assessed the appropriateness of the allocation of transaction price to each performance obligation.
◦Assessed the pattern of delivery for each distinct performance obligation.
Banc of America Merchant Services – Joint Venture Dissolution – Refer to Note 4 to the consolidated financial statements
Critical Audit Matter Description
The Company and Bank of America previously announced the planned dissolution of the Banc of America Merchant Services (“BAMS”) joint venture. Effective July 1, 2020, the Company and Bank of America dissolved the BAMS joint venture, of which the Company maintained a 51% controlling ownership interest. Due to the nature of the transaction, the dissolution was accounted for as a non-pro-rata distribution of value to Bank of America, which was accounted for at fair value resulting in the recognition of a pre-tax gain of $36 million for the Company. In determining the fair value, the Company obtained assistance from a third-party valuation specialist to measure the fair value of the client contracts intangible assets. The determination of fair value of the client contracts intangible assets required the Company to make significant judgments and assumptions related to expected future cash flows, revenue growth, retention rates and discount rate.
We identified the dissolution of the BAMS joint venture as a critical audit matter because of the significant estimates and assumptions made by the Company and the complexities of the technical accounting for the dissolution. The transaction required a high degree of auditor judgment and an increased extent of effort, including the need to involve our specialists when performing audit procedures to evaluate the reasonableness of the Company’s client contracts intangible assets attrition valuation assumptions and discount rate, as well as to analyze the associated non-pro rata fair value accounting treatment relating to the transaction.
How the Critical Audit Matter Was Addressed in the Audit
Our audit procedures related to the technical accounting and valuation of the BAMS joint venture dissolution transaction included the following, among others:
•We tested the overall accounting treatment of the transaction’s key provisions through review of the separation agreement to evaluate that the transaction was recorded appropriately under U.S. GAAP with the assistance of professionals in our firm having expertise in dissolution transactions.
•We evaluated the reasonableness of management’s expected future cash flows utilized in determining the fair value of the client contracts intangible assets by comparing the projections to the Company’s historical results, industry data and other publicly available data.
•With the assistance of our fair value specialists, we evaluated the reasonableness of the (1) valuation methodologies and (2) the retention rates and discount rate associated with the client contracts intangible assets by:
◦Assessing the appropriateness of the valuation methodologies.
◦Developing independent estimates for the retention rates and discount rate, and comparing those to the estimates selected by management.
We tested the effectiveness of internal controls over the valuation and the technical accounting treatment of the transaction.
Goodwill - Certain Reporting Units – Refer to Notes 1 and 8 to the consolidated financial statements
Critical Audit Matter Description
The Company’s evaluation of goodwill for impairment involves the comparison of the fair value of each reporting unit to its carrying value. The Company determines the fair value of its reporting units using both a discounted cash flow model and a market approach. The determination of fair value using the discounted cash flow model requires management to make significant estimates and assumptions, which include assumptions related to revenue growth rates and discount rates. The goodwill balance was $36,322 million as of December 31, 2020, of which $30,811 million was acquired as a result of the July 29, 2019 acquisition of First Data Corporation (“First Data”). For all reporting units, the fair values exceeded the carrying values and therefore, no impairment was recognized.
Four of the reporting units that were acquired as part of the First Data acquisition had goodwill balances of $813 million, $1,602 million, $1,904 million and $7,979 million, respectively, and their fair values exceeded their carrying values as of the annual assessment date by a range of 14% to 21%. Revenue growth rates and discounts rates for these four reporting units are sensitive to significant and long-term deterioration in the macroeconomic environment, industry or market conditions.
We identified goodwill for these four reporting units as a critical audit matter because of the significant estimates and assumptions management makes to estimate the fair value of these reporting units and the sensitivity of operations to changes in the macroeconomic environment, industry or market conditions. This required a high degree of auditor judgment and an increased extent of effort, including the need to involve professionals in our firm having expertise in valuation, when performing audit procedures to evaluate the reasonableness of management’s estimates and assumptions related to revenue growth rates and selection of the discount rates.
How the Critical Audit Matter Was Addressed in the Audit
Our audit procedures related to the revenue growth rates and the selection of discount rates for the four reporting units included the following, among others:
•We tested the effectiveness of controls over management’s goodwill impairment evaluation, including those over the determination of the fair value of these reporting units, specifically controls related to management’s forecasts and selection of the discount rates.
•We evaluated management’s ability to accurately forecast by comparing actual results to management’s historical forecasts.
•We evaluated the reasonableness of management’s forecasts by comparing the forecasts to (1) historical results, (2) expected results at the time of the First Data acquisition, (3) industry reports containing analyses of the Company’s and its competitors’ products and (4) forecasted information included in Company press releases as well as in analyst and industry reports of the Company and companies in its peer group.
•With the assistance of professionals in our firm having expertise in valuation, we evaluated the discount rates, including testing the underlying source information and the mathematical accuracy of the calculations and developing a range of independent estimates and comparing those to the discount rates selected by management.
/s/ Deloitte & Touche LLP
Milwaukee, Wisconsin
February 26, 2021
We have served as the Company’s auditor since 1985.
Item 9. Changes in and Disagreements with Accountants on Accounting and Financial Disclosure
Not applicable.
Item 9A. Controls and Procedures
(a)Disclosure Controls and Procedures
Our management, with the participation of our chief executive officer and chief financial officer, evaluated the design and operation of our disclosure controls and procedures (as defined in Rules 13a-15(e) and 15d-15(e) under the Securities Exchange Act of 1934). Based on this evaluation, our chief executive officer and chief financial officer concluded that our disclosure controls and procedures were effective as of December 31, 2020.
(b)Management Report on Internal Control Over Financial Reporting
Management’s Annual Report on Internal Control Over Financial Reporting
Our management is responsible for establishing and maintaining adequate internal control over financial reporting, as such term is defined in Rule 13a-15(f) under the Securities Exchange Act of 1934. Our internal control over financial reporting is designed to provide reasonable assurance regarding the reliability of financial reporting and the preparation of financial statements for external purposes in accordance with generally accepted accounting principles.
Because of its inherent limitations, internal control over financial reporting may not prevent or detect misstatements. Also, projections of any evaluation of effectiveness to future periods are subject to risk that controls may become inadequate because of changes in conditions.
Our management assessed the effectiveness of our internal control over financial reporting as of December 31, 2020. In making this assessment, management used the criteria set forth by the Committee of Sponsoring Organizations of the Treadway Commission in Internal Control – Integrated Framework (2013). Based on management’s assessment, our management believes that, as of December 31, 2020, our internal control over financial reporting was effective based on those criteria.
Our independent registered public accounting firm has issued their attestation report on our internal control over financial reporting. The report is included below under the heading “Report of Independent Registered Public Accounting Firm on Internal Control Over Financial Reporting.”
(c)Changes in Internal Control Over Financial Reporting
There was no change in our internal control over financial reporting that occurred during the quarter ended December 31, 2020 that has materially affected, or is reasonably likely to materially affect, our internal control over financial reporting.
(d)Report of Independent Registered Public Accounting Firm on Internal Control Over Financial Reporting
Our independent registered public accounting firm, Deloitte & Touche LLP, assessed the effectiveness of our internal control over financial reporting and has issued their report as set forth below.
REPORT OF INDEPENDENT REGISTERED PUBLIC ACCOUNTING FIRM
To the Shareholders and the Board of Directors of Fiserv, Inc.:
Opinion on Internal Control over Financial Reporting
We have audited the internal control over financial reporting of Fiserv, Inc. and subsidiaries (the “Company”) as of December 31, 2020, based on criteria established in Internal Control — Integrated Framework (2013) issued by the Committee of Sponsoring Organizations of the Treadway Commission (COSO). In our opinion, the Company maintained, in all material respects, effective internal control over financial reporting as of December 31, 2020, based on criteria established in Internal Control — Integrated Framework (2013) issued by COSO.
We have also audited, in accordance with the standards of the Public Company Accounting Oversight Board (United States) (PCAOB), the consolidated financial statements as of and for the year ended December 31, 2020, of the Company and our report dated February 26, 2021, expressed an unqualified opinion on those financial statements and included an explanatory paragraph regarding the Company’s adoption of a new accounting standard.
Basis for Opinion
The Company’s management is responsible for maintaining effective internal control over financial reporting and for its assessment of the effectiveness of internal control over financial reporting, included in the accompanying Management’s Annual Report on Internal Control Over Financial Reporting. Our responsibility is to express an opinion on the Company’s internal control over financial reporting based on our audit. We are a public accounting firm registered with the PCAOB and are required to be independent with respect to the Company in accordance with the U.S. federal securities laws and the applicable rules and regulations of the Securities and Exchange Commission and the PCAOB.
We conducted our audit in accordance with the standards of the PCAOB. Those standards require that we plan and perform the audit to obtain reasonable assurance about whether effective internal control over financial reporting was maintained in all material respects. Our audit included obtaining an understanding of internal control over financial reporting, assessing the risk that a material weakness exists, testing and evaluating the design and operating effectiveness of internal control based on the assessed risk, and performing such other procedures as we considered necessary in the circumstances. We believe that our audit provides a reasonable basis for our opinion.
Definition and Limitations of Internal Control over Financial Reporting
A company’s internal control over financial reporting is a process designed to provide reasonable assurance regarding the reliability of financial reporting and the preparation of financial statements for external purposes in accordance with generally accepted accounting principles. A company’s internal control over financial reporting includes those policies and procedures that (1) pertain to the maintenance of records that, in reasonable detail, accurately and fairly reflect the transactions and dispositions of the assets of the company; (2) provide reasonable assurance that transactions are recorded as necessary to permit preparation of financial statements in accordance with generally accepted accounting principles, and that receipts and expenditures of the company are being made only in accordance with authorizations of management and directors of the company; and (3) provide reasonable assurance regarding prevention or timely detection of unauthorized acquisition, use, or disposition of the company’s assets that could have a material effect on the financial statements.
Because of its inherent limitations, internal control over financial reporting may not prevent or detect misstatements. Also, projections of any evaluation of effectiveness to future periods are subject to the risk that controls may become inadequate because of changes in conditions, or that the degree of compliance with the policies or procedures may deteriorate.
/s/ Deloitte & Touche LLP
Milwaukee, Wisconsin
February 26, 2021
Item 9B. Other Information
None.
PART III
Item 10. Directors, Executive Officers and Corporate Governance
Except for information concerning our executive officers included in Part I of this Form 10-K under the caption “Information About Our Executive Officers,” which is incorporated by reference herein, and the information regarding our Code of Conduct below, the information required by Item 10 is incorporated by reference to the information set forth under the captions “Our Board of Directors – Who We Are,” “Our Board of Directors – How We Are Selected, Elected and Evaluated,” and “Our Board of Directors – How We Are Organized – Our Committees – Audit Committee” in our definitive proxy statement for our 2021 annual meeting of shareholders, which will be filed with the Securities and Exchange Commission no later than 120 days after the close of the fiscal year ended December 31, 2020.
Our board of directors has adopted a Code of Conduct and Business Ethics (“Code of Conduct”) that applies to all of our directors and employees, including our chief executive officer, chief financial officer, chief accounting officer and other persons performing similar functions as well as our other executive officers. We have posted a copy of our Code of Conduct on the “About – Investor Relations – Corporate Governance – Governance Documents” section of our website at www.fiserv.com. We intend to satisfy the disclosure requirements under Item 5.05 of Form 8-K regarding amendments to, or waivers from, the Code of Conduct by posting such information on the “About – Investor Relations” section of our website at www.fiserv.com. We are not including the information contained on our website as part of, or incorporating it by reference into, this report.
Item 11. Executive Compensation
The information required by Item 11 is incorporated by reference to the information set forth under the captions “Our Board of Directors – How We Are Paid,” “Compensation Discussion and Analysis,” “Compensation Committee Report,” “Compensation Committee Interlocks and Insider Participation,” “Executive Compensation,” and “Pay Ratio” in our definitive proxy statement for our 2021 annual meeting of shareholders, which will be filed with the Securities and Exchange Commission no later than 120 days after the close of the fiscal year ended December 31, 2020.
Item 12. Security Ownership of Certain Beneficial Owners and Management and Related Stockholder Matters
The information set forth under the caption “Our Shareholders – Common Stock Ownership” in our definitive proxy statement for our 2021 annual meeting of shareholders, which will be filed with the Securities and Exchange Commission no later than 120 days after the close of the fiscal year ended December 31, 2020, is incorporated by reference herein.
Equity Compensation Plan Information
The table below sets forth information with respect to compensation plans under which equity securities are authorized for issuance as of December 31, 2020.
| | | | | | | | | | | |
| (a) | (b) | (c) |
| Plan Category | Number of shares
to be issued upon
exercise of
outstanding options,
warrants and rights | Weighted-average
exercise price of
outstanding options,
warrants and rights | Number of shares
remaining available for
future issuance under
equity compensation
plans (excluding
securities reflected in
column (a)) |
Equity compensation plans approved by our shareholders (1) | 10,151,547 (2) | 56.59 (3) | 30,452,373 (4) |
Equity compensation plans not approved by our shareholders | N/A | N/A | N/A |
Total (5) | 10,151,547 (2) | 56.59 (3) | 30,452,373 (4) |
(1)Columns (a) and (c) of the table above do not include 2,436,442 unvested restricted stock units outstanding under the Amended and Restated Fiserv, Inc. 2007 Omnibus Incentive Plan (the “Incentive Plan”) or 24,230,938 shares authorized for issuance under the Fiserv, Inc. Amended and Restated Employee Stock Purchase Plan.
(2)Consists of options outstanding under the Incentive Plan; 149,132 shares subject to performance share units under the Incentive Plan at the actual award level where the conditions to vesting have been satisfied; 1,027,049 shares subject to performance share units under the Incentive Plan at the target award level where the conditions to vesting have not yet been satisfied; and 98,924 shares subject to non-employee director deferred compensation notional units under the Incentive Plan.
(3)Represents the weighted-average exercise price of outstanding options under the Incentive Plan and does not take into account outstanding performance share units or non-employee director deferred compensation notional units under the Incentive Plan.
(4)Reflects the number of shares available for future issuance under the Incentive Plan.
(5)This table does not include 5,812,408 options outstanding under the 2007 Stock Incentive Plan for Key Employees of First Data Corporation and its Affiliates (the “2007 First Data Plan”) and the First Data Corporation 2015 Omnibus Incentive Plan (the “2015 First Data Plan” and together with the 2007 First Data Plan, the “First Data Plans”) as of December 31, 2020 at a weighted-average exercise price of $42.00. We assumed the First Data Plans in connection with our acquisition of First Data Corporation on July 29, 2019 and converted certain outstanding First Data equity awards into corresponding equity awards relating to common stock of Fiserv, Inc. in accordance with an exchange ratio in the merger agreement as further described in Note 4 to the accompanying consolidated financial statements. This table also does not include 2,906,696 shares of restricted stock and restricted stock units outstanding under the 2015 First Data Plan, as of December 31, 2020. No additional equity awards will be made under the First Data Plans.
Item 13. Certain Relationships and Related Transactions, and Director Independence
The information required by Item 13 is incorporated by reference to the information set forth under the captions “Our Board of Directors – How We Are Organized – Our Independence,” and “Our Board of Directors – How We Govern – Review, Approval or Ratification of Transactions with Related Persons,” in our definitive proxy statement for our 2021 annual meeting of shareholders, which will be filed with the Securities and Exchange Commission no later than 120 days after the close of the fiscal year ended December 31, 2020.
Item 14. Principal Accounting Fees and Services
The information required by Item 14 is incorporated by reference to the information set forth under the captions “Independent Registered Public Accounting Firm and Fees” and “Audit Committee Pre-Approval Policy” in our definitive proxy statement for our 2021 annual meeting of shareholders, which will be filed with the Securities and Exchange Commission no later than 120 days after the close of the fiscal year ended December 31, 2020.
PART IV
Item 15. Exhibits, Financial Statement Schedules
Financial Statement Schedules
Financial statement schedules have been omitted because they are not applicable or the required information is shown in the consolidated financial statements or accompanying notes.
Exhibits
The exhibits listed in the accompanying exhibit index are filed as part of this Annual Report on Form 10-K.
EXHIBIT INDEX
| | | | | | | | |
Exhibit Number | Exhibit Description |
| 2.1 | |
| 3.1 | |
| 3.2 | |
| 4.1 | |
| 4.2 | |
| 4.3 | |
| 4.4 | |
| 4.5 | |
| 4.6 | |
| 4.7 | |
| 4.8 | |
| | |
| 4.9 | |
| 4.10 | |
| 4.11 | |
| 4.12 | |
| 4.13 | |
| 4.14 | |
| 4.15 | |
| 4.16 | |
| 4.17 | |
| 4.18 | |
| 4.19 | |
| | | | | | | | |
| 4.20 | |
| 4.21 | |
| 4.22 | |
| 4.23 | |
| 4.24 | |
| 4.25 | |
| 4.26 | |
| 4.27 | |
| 4.28 | |
| | Pursuant to Item 601(b)(4)(iii) of Regulation S-K, the Company agrees to furnish to the Securities and Exchange Commission, upon request, any instrument defining the rights of holders of long-term debt that is not filed as an exhibit to this Form 10-K. |
| 10.1 | |
| | Amended and Restated Fiserv, Inc. 2007 Omnibus Incentive Plan Forms of Award Agreements |
| 10.2 | |
| | |
| | |
| 10.3 | |
| | |
| 10.4 | |
| 10.5 | |
| 10.6 | |
| 10.7 | |
| 10.8 | |
| 10.9 | |
| 10.10 | |
| 10.11 | |
| 10.12 | |
| 10.13 | |
| 10.14 | |
| 10.15 | |
| 10.16 | |
| 10.17 | |
| 10.18 | |
| | |
| 10.19 | |
| | |
| 10.20 | |
| 10.21 | |
| | 2007 Stock Incentive Plan for Key Employees of First Data Corporation and its Affiliates Forms of Award Agreements |
| 10.22 | |
| 10.23 | |
| 10.24 | |
| | First Data Corporation 2015 Omnibus Incentive Plan Forms of Award Agreements |
| 10.25 | |
| | | | | | | | |
| 10.26 | |
| | |
| | |
| 10.27 | |
| 10.28 | |
| 10.29 | |
| 10.30 | |
| 10.31 | |
| 10.32 | |
| 10.33 | |
| 10.34 | |
| 10.35 | |
| 10.36 | |
| 10.37 | |
| 10.38 | |
| 10.39 | |
| 10.40 | |
| 10.41 | |
| 10.42 | |
| 10.43 | |
| 10.44 | |
| 10.45 | |
| 10.46 | |
| 10.47 | |
| 10.48 | |
| 21.1 | |
| 23.1 | |
| 31.1 | |
| 31.2 | |
| 32.1 | |
| 101.INS** | Inline XBRL Instance Document - The XBRL Instance Document does not appear in the interactive data file because its XBRL tags are embedded within the Inline XBRL document. |
| 101.SCH** | Inline XBRL Taxonomy Extension Schema Document |
| 101.CAL** | Inline XBRL Taxonomy Extension Calculation Linkbase Document |
| 101.DEF** | Inline XBRL Taxonomy Extension Definition Linkbase Document |
| 101.LAB** | Inline XBRL Taxonomy Extension Label Linkbase Document |
| 101.PRE** | Inline XBRL Taxonomy Extension Presentation Linkbase Document |
| 104 | Cover Page Interactive Data File (formatted as Inline XBRL and contained in Exhibit 101) |
_____
* This exhibit is a management contract or compensatory plan or arrangement.
** Filed with this Annual Report on Form 10-K are the following documents formatted in iXBRL (Inline Extensible Business Reporting Language): (i) the Consolidated Statements of Income for the years ended December 31, 2020, 2019,
and 2018, (ii) the Consolidated Statements of Comprehensive Income for the years ended December 31, 2020, 2019, and 2018, (iii) the Consolidated Balance Sheets at December 31, 2020 and 2019, (iv) the Consolidated Statements of Equity for the years ended December 31, 2020, 2019, and 2018, (v) the Consolidated Statements of Cash Flows for the years ended December 31, 2020, 2019, and 2018, and (vi) Notes to Consolidated Financial Statements.
(1)Previously filed as an exhibit to the Company’s Current Report on Form 8-K filed on January 18, 2019, and incorporated herein by reference.
(2)Previously filed as an exhibit to the Company’s Current Report on Form 8-K filed on February 27, 2018, and incorporated herein by reference.
(3)Previously filed as an exhibit to the Company’s Current Report on Form 8-K filed on November 2, 2020, and incorporated herein by reference.
(4)Previously filed as an exhibit to the Company’s Annual Report on Form 10-K filed on February 27, 2020, and incorporated herein by reference.
(5)Previously filed as an exhibit to the Company’s Current Report on Form 8-K filed on September 20, 2018, and incorporated herein by reference.
(6)Previously filed as an exhibit to the Company’s Current Report on Form 8-K filed on February 7, 2019, and incorporated herein by reference.
(7)Previously filed as an exhibit to the Company’s Annual Report on Form 10-K filed on February 21, 2019, and incorporated herein by reference.
(8)Previously filed as an exhibit to the Company’s Current Report on Form 8-K filed on July 29, 2019, and incorporated herein by reference.
(9)Previously filed as an exhibit to the Company’s Registration Statement on Form S-3 (File No. 333‑147309) filed on November 13, 2007, and incorporated herein by reference.
(10)Previously filed as an exhibit to the Company’s Current Report on Form 8-K filed on June 14, 2011, and incorporated herein by reference.
(11)Previously filed as an exhibit to the Company’s Current Report on Form 8-K filed on September 25, 2012, and incorporated herein by reference.
(12)Previously filed as an exhibit to the Company’s Current Report on Form 8-K filed on May 22, 2015, and incorporated herein by reference.
(13)Previously filed as an exhibit to the Company’s Current Report on Form 8-K filed on September 25, 2018, and incorporated herein by reference.
(14)Previously filed as an exhibit to the Company’s Current Report on Form 8-K filed on June 24, 2019, and incorporated herein by reference.
(15)Previously filed as an exhibit to the Company’s Current Report on Form 8-K filed on July 1, 2019, and incorporated herein by reference.
(16)Previously filed as an exhibit to the Company’s Current Report on Form 8-K filed on May 13, 2020, and incorporated herein by reference.
(17)Previously filed as an exhibit to the Company’s Current Report on Form 8-K filed on September 9, 2019, and incorporated herein by reference.
(18)Previously filed as an exhibit to the Company’s Quarterly Report on Form 10-Q filed on May 2, 2018, and incorporated herein by reference.
(19)Previously filed as an exhibit to the Company’s Annual Report on Form 10-K filed on February 24, 2012, and incorporated herein by reference.
(20)Previously filed as an exhibit to the Company’s Annual Report on Form 10-K filed on February 23, 2017, and incorporated herein by reference.
(21)Previously filed as an exhibit to the Company’s Quarterly Report on Form 10-Q filed on August 2, 2017, and incorporated herein by reference.
(22)Previously filed as an exhibit to the Company’s Current Report on Form 8-K filed on December 1, 2017, and incorporated herein by reference.
(23)Previously filed as an exhibit to the Company’s Annual Report on Form 10-K filed on February 20, 2015, and incorporated herein by reference.
(24)Previously filed as an exhibit to the Company’s Post-Effective Amendment No. 1 on Form S-8 to the Form S-4 Registration Statement of Fiserv, Inc. filed July 29, 2019, and incorporated herein by reference.
(25)Previously filed as an exhibit to the Company’s Quarterly Report on Form 10-Q filed on November 7, 2019, and incorporated herein by reference.
(26)Previously filed as an exhibit to the Company’s Current Report on Form 8-K filed on December 23, 2008, and incorporated herein by reference.
(27)Previously filed as an exhibit to the Company’s Annual Report on Form 10-K filed on February 27, 2009, and incorporated herein by reference.
(28)Previously filed as an exhibit to the Company’s Current Report on Form 8-K filed on December 30, 2009, and incorporated herein by reference.
(29)Previously filed as an exhibit to the Company’s Current Report on Form 8-K filed on April 1, 2016, and incorporated herein by reference.
(30)Previously filed as an exhibit to the Company’s Quarterly Report on Form 10-Q filed on May 8, 2020, and incorporated herein by reference.
(31)Previously filed as an exhibit to the Company’s Quarterly Report on Form 10-Q filed on October 30, 2013, and incorporated herein by reference.
(32)Previously filed as an exhibit to the Company’s Annual Report on Form 10-K filed on February 20, 2014, and incorporated herein by reference.
(33)Previously filed as an exhibit to the Company’s Current Report on Form 8-K filed on February 16, 2016, and incorporated herein by reference.
(34)Previously filed as an exhibit to the Company’s Quarterly Report on Form 10-Q filed on May 6, 2016, and incorporated herein by reference.
(35)Previously filed as an exhibit to First Data Corporation’s Annual Report on Form 10-K filed on February 27, 2015 and incorporated herein by reference.
(36)Previously filed as an exhibit to the Company’s Annual Report on Form 10-K filed on February 28, 2008, and incorporated herein by reference.
Item 16. Form 10-K Summary
None.
SIGNATURES
Pursuant to the requirements of Section 13 or 15(d) of the Securities Exchange Act of 1934, the registrant has duly caused this report to be signed on its behalf by the undersigned, thereunto duly authorized on February 26, 2021.
| | | | | | | | |
| FISERV, INC. |
| | |
| By: | /s/ Frank J. Bisignano |
| | Frank J. Bisignano |
| | President and Chief Executive Officer |
Pursuant to the requirements of the Securities Exchange Act of 1934, this report has been signed below by the following persons on behalf of the registrant and in the capacities indicated on February 26, 2021.
| | | | | | | | |
| Name | | Capacity |
| | |
| /s/ Denis J. O’Leary | | Chairman of the Board |
| Denis J. O’Leary | |
| | |
| /s/ Frank J. Bisignano | | Director, President and Chief Executive Officer
(Principal Executive Officer) |
| Frank J. Bisignano | |
| | |
| /s/ Robert W. Hau | | Chief Financial Officer
(Principal Financial Officer)
|
| Robert W. Hau | |
| | |
| /s/ Kenneth F. Best | | Chief Accounting Officer
(Principal Accounting Officer)
|
| Kenneth F. Best | |
| | |
| /s/ Alison Davis | | Director |
| Alison Davis | | |
| | |
| /s/ Henrique De Castro | | Director |
| Henrique De Castro | |
| | |
| /s/ Harry F. DiSimone | | Director |
| Harry F. DiSimone | | |
| | |
| /s/ Dennis F. Lynch | | Director |
| Dennis F. Lynch | | |
| | |
| /s/ Heidi G. Miller | | Director |
| Heidi G. Miller | | |
| | |
| /s/ Scott C. Nuttall | | Director |
| Scott C. Nuttall | | |
| | |
| /s/ Doyle R. Simons | | Director |
| Doyle R. Simons | | |
| | |
| /s/ Kevin M. Warren | | Director |
| Kevin M. Warren | | |
| | |