UNITED STATES
SECURITIES AND EXCHANGE COMMISSION
WASHINGTON, DC 20549
FORM 10-K
|
| | |
þ | ANNUAL REPORT PURSUANT TO SECTION 13 OR 15(d) OF THE SECURITIES EXCHANGE ACT OF 1934 |
For the fiscal year ended: | December 31, 2017 |
OR
|
| |
¨ | TRANSITION REPORT PURSUANT TO SECTION 13 OR 15(d) OF THE SECURITIES EXCHANGE ACT OF 1934 For the transition period from to |
Commission file number: 0-14948
Fiserv, Inc.
(Exact Name of Registrant as Specified in Its Charter)
|
| | |
Wisconsin (State or Other Jurisdiction of Incorporation or Organization) | | 39-1506125 (I.R.S. Employer Identification No.) |
255 Fiserv Dr., Brookfield, WI 53045
(Address of Principal Executive Offices, Including Zip Code)
Registrant’s telephone number, including area code: (262) 879-5000
Securities registered pursuant to Section 12(b) of the Act:
|
| | |
Title of Each Class | | Name of Each Exchange on Which Registered |
Common Stock, par value $0.01 per share | | The NASDAQ Stock Market LLC |
Securities registered pursuant to Section 12(g) of the Act: None
Indicate by check mark if the registrant is a well-known seasoned issuer, as defined in Rule 405 of the Securities Act. Yes þ No ¨
Indicate by check mark if the registrant is not required to file reports pursuant to Section 13 or 15(d) of the Act. Yes ¨ No þ
Indicate by check mark whether the registrant: (1) has filed all reports required to be filed by Section 13 or 15(d) of the Securities Exchange Act of 1934 during the preceding 12 months (or for such shorter period that the registrant was required to file such reports), and (2) has been subject to such filing requirements for the past 90 days. Yes þ No ¨
Indicate by check mark whether the registrant has submitted electronically and posted on its corporate Web site, if any, every Interactive Data File required to be submitted and posted pursuant to Rule 405 of Regulation S-T during the preceding 12 months (or for such shorter period that the registrant was required to submit and post such files). Yes þ No ¨
Indicate by check mark if disclosure of delinquent filers pursuant to Item 405 of Regulation S-K is not contained herein, and will not be contained, to the best of registrant’s knowledge, in definitive proxy or information statements incorporated by reference in Part III of this Form 10-K or any amendment to this Form 10-K. ¨
Indicate by check mark whether the registrant is a large accelerated filer, an accelerated filer, a non-accelerated filer, a smaller reporting company, or an emerging growth company. See the definitions of “large accelerated filer,” “accelerated filer,” “smaller reporting company,” and “emerging growth company” in Rule 12b-2 of the Exchange Act.
Large Accelerated Filer þ Accelerated Filer ¨ Non-Accelerated Filer ¨ Smaller Reporting Company ¨ Emerging Growth Company ¨
If an emerging growth company, indicate by check mark if the registrant has elected not to use the extended transition period for complying with any new or revised financial accounting standards provided pursuant to Section 13(a) of the Exchange Act. ¨
Indicate by check mark whether the registrant is a shell company (as defined in Rule 12b-2 of the Exchange Act). Yes ¨ No þ
The aggregate market value of the common stock of the registrant held by non-affiliates as of June 30, 2017 (the last trading day of the second fiscal quarter) was $25,747,259,465 based on the closing price of the registrant’s common stock on the NASDAQ Global Select Market on that date. The number of shares of the registrant’s common stock, $0.01 par value per share, outstanding at February 16, 2018 was 206,607,864.
DOCUMENTS INCORPORATED BY REFERENCE
Part III of this report incorporates information by reference to the registrant’s proxy statement for its 2018 annual meeting of shareholders, which proxy statement will be filed with the Securities and Exchange Commission no later than 120 days after the close of the fiscal year ended December 31, 2017.
TABLE OF CONTENTS
|
| | |
| | Page |
PART I | |
| | |
Item 1. | | |
| | |
Item 1A. | | |
| | |
Item 1B. | | |
| | |
Item 2. | | |
| | |
Item 3. | | |
| | |
Item 4. | | |
| | |
| | |
| |
PART II | |
| | |
Item 5. | | |
| | |
Item 6. | | |
| | |
Item 7. | | |
| | |
Item 7A. | | |
| | |
Item 8. | | |
| | |
Item 9. | | |
| | |
Item 9A. | | |
| | |
Item 9B. | | |
| |
PART III | |
| | |
Item 10. | | |
| | |
Item 11. | | |
| | |
Item 12. | | |
| | |
Item 13. | | |
| | |
Item 14. | | |
| |
PART IV | |
| | |
Item 15. | | |
| | |
Item 16. | | |
| | |
| | |
FORWARD-LOOKING STATEMENTS
This Annual Report on Form 10-K contains “forward-looking statements” intended to qualify for the safe harbor from liability established by the Private Securities Litigation Reform Act of 1995. Forward-looking statements include those that express a plan, belief, expectation, estimation, anticipation, intent, contingency, future development or similar expression, and can generally be identified as forward-looking because they include words such as “believes,” “anticipates,” “expects,” “could,” “should” or words of similar meaning. Statements that describe our future plans, objectives or goals are also forward-looking statements. The forward-looking statements in this report involve significant risks and uncertainties, and a number of factors, both foreseen and unforeseen, could cause actual results to differ materially from our current expectations. The factors that may affect our results include, among others: pricing and other actions by competitors; the capacity of our technology to keep pace with a rapidly evolving marketplace; the impact of a security breach or operational failure on our business; the effect of legislative and regulatory actions in the United States and internationally; our ability to comply with government regulations; our ability to successfully identify, complete and integrate acquisitions, and to realize the anticipated benefits associated with the same; our ability to successfully complete the sale of a 55% interest of our lending solutions business on the anticipated terms and timeline or at all; the impact of our strategic initiatives; the impact of market and economic conditions on the financial services industry; and other factors discussed in this report under the heading “Risk Factors.” You should consider these factors carefully in evaluating forward-looking statements and are cautioned not to place undue reliance on such statements, which speak only as of the date of this report. We undertake no obligation to update forward-looking statements to reflect events or circumstances occurring after the date of this report. We are not including the information provided on the websites referenced herein as part of, or incorporating such information by reference into, this Annual Report on Form 10-K.
PART I
In this report, all references to “we,” “us” and “our” refer to Fiserv, Inc. (“Fiserv”), a Wisconsin corporation, and, unless the context otherwise requires, its consolidated subsidiaries.
Item 1. Business
Overview
Fiserv, Inc. is a leading global provider of financial services technology. We are publicly traded on the NASDAQ Global Select Market and part of the S&P 500 Index. We serve over 12,000 clients worldwide, including banks, savings banks, credit unions, investment management firms, leasing and finance companies, billers, retailers, merchants, and building societies. We provide account processing systems; electronic payments processing products and services, such as electronic bill payment and presentment services, card-based transaction processing and network services, ACH transaction processing, account-to-account transfers, and person-to-person payments; internet and mobile banking systems; and related services including document and payment card production and distribution, check processing and imaging, source capture systems, and lending and risk management products and services. Most of the services we provide are necessary for our clients to operate their businesses and are, therefore, non-discretionary in nature. Our operations are principally located in the United States where we operate data and transaction processing centers, provide technology support, develop software and payment solutions, and offer consulting services.
In 2017, we had $5.7 billion in total revenue, $1.5 billion in operating income and $1.5 billion of net cash provided by operating activities from continuing operations. Processing and services revenue, which in 2017 represented 85% of our total revenue, is primarily generated from account- and transaction-based fees under contracts that generally have terms of three to five years and high renewal rates. Revenue from clients outside the United States comprised approximately 5% of total revenue in each of 2017 and 2016 and 6% in 2015.
We have grown our business by developing highly specialized product and service enhancements, extending our capabilities through innovation, welcoming new clients, selling additional products and services to existing clients, and acquiring businesses that complement ours, all of which have enabled us to deliver a wide range of integrated products and services and have created new opportunities for growth.
We originally incorporated in Delaware in 1984 and reincorporated as a Wisconsin corporation in 1992. Our headquarters are located at 255 Fiserv Drive, Brookfield, Wisconsin 53045, and our telephone number is (262) 879-5000.
Our operations are reported in the Payments and Industry Products (“Payments”) and Financial Institution Services (“Financial”) business segments. Financial information regarding our business segments is included in Note 9 to the consolidated financial statements.
Payments
The businesses in our Payments segment provide financial institutions and other companies with the products and services required to process electronic payment transactions and to offer their customers access to financial services and transaction capability through digital channels. Financial institutions and other companies have increasingly relied on third-party providers for those products and services, either on a licensed software or outsourced basis, as an increasing number of payment transactions are completed electronically as our clients’ customers seek the convenience of 24-hour digital access to their financial accounts. Within the Payments segment, we primarily provide electronic bill payment and presentment services, internet and mobile banking software and services, account-to-account transfers, person-to-person payment services, debit and credit card processing and services, payments infrastructure services, and other electronic payments software and services. Our businesses in this segment also provide card and print personalization services, investment account processing services for separately managed accounts, and fraud and risk management products and services. Our solutions in the Payments segment include:
Electronic Payments
Our electronic payments business is comprised of electronic bill payment and presentment services and other electronic payment services for businesses and consumers, such as person-to-person payments, account-to-account transfers, account opening and funding, and small business invoicing and payments. Our principal electronic bill payment and presentment product, CheckFree® RXP®, allows our clients’ customers: to manage household bills via an easy-to-use, online tool; to view billing and payment information; to pay and manage all of their bills in one place; and to complete same-day or next-day bill payments to a wide range of billers and others.
Our person-to-person payments solution, Popmoney®, allows consumers a convenient way to send and receive money while offering financial institutions the opportunity to generate new transaction-based revenue, attract new accounts and increase loyalty among existing customers. More than 2,500 financial institutions have agreed to offer our person-to-person payments services to their customers as of December 31, 2017. In addition to Popmoney, we partner with Early Warning Services, LLC to offer a turnkey implementation of its Zelle® real-time person-to-person payments service. Our turnkey solution simplifies the implementation of Zelle by providing interface, risk management, alerting, settlement and other services to clients.
Digital Channels
Our principal digital consumer and business banking products are Architect™, Corillian Online®, Corillian® Business Online, FINkit™, Mobiliti™, and Mobiliti Business™. Our Corillian product suite supports multiple lines of banking businesses and has been designed to be highly scalable to meet the evolving needs of our clients. This structure enables our clients to deploy new services by adding and integrating applications, such as electronic bill payment, person-to-person payments and personal financial management tools, to any internet connected point-of-presence. Our Mobiliti product suite provides a variety of mobile banking and payments services to our clients and their customers via mobile browser, downloadable application for smart phones and tablets, text message, and Amazon® Echo Alexa voice banking. We also provide the advanced capabilities of Corillian Online and Mobiliti as an outsourced service, known as Corillian Online ASP and Mobiliti ASP. Our Architect product suite supports online, mobile and tablet banking for retail and small business customers on a single platform. Each of these suites enables customers to complete balance inquiries, view their transaction history, make bill payments, and transfer funds between accounts and other people. As of December 31, 2017, we had approximately 2,300 Mobiliti ASP clients.
In the third quarter of 2017, we completed the acquisition of Monitise plc, a provider of digital solutions, including FINkit, that enables innovative digital banking experiences for leading financial institutions worldwide.
Card Services
Our card services business is a leader in electronic funds transfer and provides a total payments solution through a variety of products and services. We provide thousands of financial institution clients with a full range of credit and debit processing services, including: ATM monitoring, tokenization, loyalty and reward programs, real-time person-to-person payments, customized authorization processing, direct access and settlement for networks, and risk management solutions. We own and operate the Accel® network, which serves more than 3,000 financial institutions with funds access at over 500,000 ATMs and incorporates CardFree CashSM access as well as EMV™ chip and traditional magnetic stripe cards. Our Accel network point of sale support delivers comprehensive coverage of PIN and signature authentication support at physical and electronic commerce merchants across the country. Our digital enablement capability provides our clients’ consumers with mobile-based, customizable card management and alert tools that drive engagement and revenue for our issuers, and our risk management tools and portfolio management services are integrated with real-time fraud decisioning.
Biller Solutions
Our biller business provides electronic billing and payment services to companies that deliver bills to their customer base, such as utilities, telephone and cable companies, consumer lending institutions, and insurance providers, enabling our biller clients to reduce costs, collect payments faster through multiple channels, increase customer satisfaction, and provide customers flexible, easy-to-use ways to view and pay their bills. Our clients’ customers access our electronic billing and payment systems by viewing or paying a bill through a financial institution’s bill payment application, using a biller’s website, mobile application or automated phone system, leveraging www.mycheckfree.com, or by paying in person at one of more than 24,000 nationwide walk-in payment locations. These diverse options allow our clients’ customers to view and pay bills wherever, whenever and however they feel most comfortable. Furthermore, because our biller clients are able to receive all of these services from us, we can eliminate the operational complexity and expense of supporting multiple vendor systems or in-house developed systems.
Output Solutions
Our output solutions business provides business communication solutions to clients across a wide variety of industries, including financial services, healthcare, retail, utilities, and travel and entertainment. Our products and services include: electronic document management through our electronic document delivery products and services; card manufacturing, personalization and mailing; statement production and mailing; design and fulfillment of direct mail solutions; forms distribution; laser printing and mailing; branded merchandise; and office supplies.
Investment Services
Our investment services business provides technology solutions that enable financial planning, portfolio management and trading, model management, performance measurement, and reporting products and services to financial service organizations, including broker dealers, registered investment advisors, banks, asset managers and insurance companies that deliver financial advice and managed account products to U.S. retail investors. Our investment services business also supports global institutional asset managers and asset servicers with portfolio accounting, performance analytics, fee billing and revenue management, and post-trade processing technology. Our primary product, the Unified Wealth Platform, is a real-time portfolio management, trading and reporting system used by some of the largest brokerage firms and asset managers in the U.S. offering managed accounts.
Risk Management and Other Solutions
Our risk management solutions business provides financial and risk management products and services that deliver operating efficiencies and management insight that enable our clients to protect and grow their businesses. Our Enterprise Performance Management and Financial Control Solutions offerings include budgeting and planning, financial accounting, and automated reconciliation and account certification tools to facilitate a robust assessment environment and efficient close process for our clients. These solutions are further complemented by fraud detection and mitigation through our predictive analytics solution, Fraud Risk and Anti-Money Laundering Compliance Management.
In the third quarter of 2017, we acquired Dovetail Group Limited (“Dovetail”), a leading provider of bank payments and liquidity management solutions. The Dovetail payments platform helps financial institutions enable real-time payments and integrate into a broad range of payment solutions.
Financial
The businesses in our Financial segment provide financial institutions with the products and services they need to run their operations. By licensing software from third parties or outsourcing their processing requirements by contracting with third-party processors, financial institutions are typically able to reduce costs and enhance their products, services, capacity and capabilities. For example, the licensing of software reduces the need for costly technical expertise within a financial institution, and outsourcing processing operations reduces the infrastructure and other costs required to operate systems internally. Within the Financial segment, we provide depository institutions and leasing and finance companies with account processing services, item processing and source capture services, loan origination and servicing products, cash management and consulting services, and other products and services that support numerous types of financial transactions. Many of the products and services that we sell are integrated with solutions from our Payments segment such as electronic bill payment and presentment, internet and mobile banking, debit processing and network services, and person-to-person payments. Our solutions in the Financial segment include:
Account Processing
We provide account servicing and management technology solutions to our depository institution clients, as well as a range of integrated, value-added banking products and services. Account processing solutions are the principal systems that enable a financial institution to operate systems that process customer deposit and loan accounts, an institution’s general ledger, central information files and other financial information. These solutions also include extensive security, report generation and other features that financial institutions need to process transactions for their customers, as well as to comply with applicable regulations. Although many of our clients contract to obtain a majority of their processing requirements from us, our software design allows clients to start with one application and, as needed, add applications and features developed by us or by third parties. We support a broad range of client-owned peripheral devices manufactured by a variety of vendors, which reduces a new client’s initial conversion expenses, enhances existing clients’ ability to change technology and broadens our market opportunity.
The principal account processing solutions used by our bank clients are Cleartouch®, DNA®, Precision®, Premier®, Signature® and TotalPlus®. The principal account processing solutions primarily used by our credit union clients are CharlotteSM, CubicsPlus®, CUnify™, CUSA®, DataSafe®, DNA, Galaxy®, OnCU®, Portico®, Spectrum® and XP2®. The Signature and DNA systems are available both domestically and internationally. In addition, we offer Agiliti™ as a software-as-a-service solution to the U.K. financial institutions. Account processing solutions are generally offered as an outsourced service or as licensed software for installation on client-owned or -hosted computer systems.
Item Processing
Our item processing business offers products and services to financial institutions. Through the Fiserv Clearing Network, we provide check clearing and image exchange services. Other solutions include image archive with online retrieval, in-clearings, exceptions and returns, statements and fraud detection. We also provide consulting services, business operations services and related software products that promote change in deposit behavior to transition check capture from branch and teller channels to digital self-service deposit channels including mobile, merchant and ATM.
Lending and Other Solutions
Our lending business offers life-of-loan digital products and services to financial institutions, including loan originations, servicing and default systems primarily for auto, consumer and real estate. In addition, our lending solutions include a full complement of professional services such as customization, business process outsourcing, training, consulting and implementation services. On February 7, 2018, we announced a definitive agreement to sell a 55% interest of our lending solutions business. We will retain a 45% interest in the joint venture, which will include all of our automotive loan origination and servicing products, as well as our LoanServ platform. The transaction, which is subject to customary closing conditions, is targeted to close in the first quarter of 2018.
Other businesses in this segment provide solutions for ACH and treasury management, case management and resolution, and source capture optimization to the financial services industry. Our offerings include Immediate FundsSM, PEP+®, and our remote deposit capture solutions branded as Source Capture Solutions®.
In the first quarter of 2017, we completed our acquisition of Online Banking Solutions, Inc. (“OBS”), a provider of cash management and digital business banking solutions that complement and enrich our existing solutions. OBS products are integrated across a number of our account processing solutions and with other account processing platforms, and will enable our bank and credit union clients to better serve their commercial customers. In the third quarter of 2017, we acquired the assets of PCLender, LLC (“PCLender”), a leader in internet-based mortgage software and mortgage lending technology solutions, enhancing our suite of mortgage origination services to financial institutions of all sizes.
Our Strategy
Our vision is to be a global leader in transaction-based technology solutions. Our mission is to provide integrated technology and services solutions that enable best-in-class results for our clients. We are focused on operating businesses where we have: deep industry expertise that enables us to serve the market with high effectiveness; a strong competitive position, currently or via a clear path in the foreseeable future; long-term, trusted client relationships that are based on recurring services and transactions; differentiated solutions that deliver value to our clients through integration and innovation; and strong management to execute strategies in a disciplined manner. Consistent with this focus, we continue to operate our business in accordance with the following strategic framework:
| |
• | Portfolio Management. We expect to acquire businesses when we identify: a compelling strategic need, such as a product, service or technology that helps meet client demand; an opportunity to change industry dynamics; a way to achieve business scale; or similar considerations. We expect to divest businesses that are not in line with our market, product or financial strategies. |
| |
• | Client Relationship Value. We plan to increase the number and breadth of our client relationships by, among other actions: continuing to integrate our products and services; introducing new products and services that are aligned with market needs; combining products and services to deliver enhanced, integrated value propositions; and improving the quality of our client service and support. |
| |
• | Operational Effectiveness. We believe we can improve the quality of our client delivery while reducing our costs by using the opportunities created by our size and scale. For example, we are using our consolidated buying power and optimizing our facilities to create cost savings. |
| |
• | Capital Discipline. We intend to make capital allocation decisions that offer the best prospects for our long-term growth and profitability, which may include, among other matters, internal investment, repayment of debt, repurchases of our own shares or acquisitions. |
| |
• | Innovation. We seek to be an innovation leader, utilizing our assets and capabilities to be at the forefront of our industry and enable our clients to deliver best-in-class results. |
Servicing the Market
The markets for our account and transaction processing services have specific needs and requirements, with strong emphasis placed by clients on quality, security, integration with other product lines, service reliability, timely introduction of new products and features, flexibility and value. We believe that our financial strength and primary focus on the financial services industry enhances our ability to meet these needs and service our clients. In addition, we believe that our dedication to providing excellent client service and support no matter the size of the client and our commitment of substantial resources to training and technical support helps us to identify and fulfill the needs of our clients.
Product Development
To meet the changing technology needs of our clients, we continually develop, maintain and enhance our products and systems. Product development expenditures represented approximately 8% of our total revenue in each of 2017 and 2016 and 9% in 2015. Our development and technology centers apply the expertise of multiple teams to design, develop and maintain specialized processing systems. Our account processing systems are designed to meet the preferences and diverse requirements of the international, national, regional or local market-specific financial service environments of our clients. In developing our products, we use current software development principles, such as service-oriented architecture, to create efficiencies, and we stress interaction with and responsiveness to the needs of our clients.
Intellectual Property
We regard our software, transaction processing services and related products as proprietary, and we utilize a combination of patent, copyright, trademark and trade secret laws, internal security practices, and employee and third party non-disclosure agreements to protect our intellectual property assets. Our patents cover innovations relating to numerous financial software products and services, and we continue, where appropriate, to seek and secure patents with respect to our ongoing innovations. We believe that we possess all proprietary rights necessary to conduct our business.
Competition
The market for technology products and services in the financial industry is highly competitive. Our principal competitors include other vendors of financial services technology, data processing affiliates of large companies, and processing centers owned and operated as user cooperatives. Outside the U.S., our primary competitors include global and local IT product and services companies, as well as payment service providers and processors. We expect competition to continue to increase as new companies enter our markets and existing competitors expand their product lines and services. Some of these competitors possess substantially greater financial, sales and marketing resources than we do and have substantial flexibility in competing with us, including through the use of integrated product offerings and through pricing. Competitive factors for our business include product quality, security, integration with other product lines, service reliability, timely introduction of new products and features, flexibility and value. We believe that we compete favorably in each of these categories. Additional information about competition in our segments is provided below.
Payments
The businesses in our Payments segment compete with a number of competitors, including ACI Worldwide, Inc., Fidelity National Information Services, Inc. (“FIS”), First Data Corporation, Jack Henry and Associates Inc. (“Jack Henry”), KUBRA Data Transfer, Ltd., MasterCard Incorporated, NCR Corporation, Paymentech, LLC, Paymentus Corporation, PayPal Holdings, Inc., Q2 Holdings, Inc., R.R. Donnelley & Sons Company, Total System Services, Inc., U.S. Bancorp, Visa Inc., The Western Union Company and Worldpay, Inc. In addition to traditional payments competitors, large technology, media and other providers are increasingly seeking to provide or facilitate a wide range of point of sale and non-point of sale payments. These newer competitors include, but are not limited to, Alphabet Inc., Amazon.com, Inc., Apple Inc., Facebook, Inc., Intuit Inc., Samsung Group, Starbucks Corporation and Wal-Mart Stores, Inc. Existing and potential financial institution and biller clients, could also develop and use their own in-house systems instead of our products and services. In addition, many companies that provide solutions to the financial services industry are consolidating, creating larger competitors with greater resources and broader product lines.
Financial
Our products and services in the Financial segment compete in several different market segments and geographies, including with large, diversified software and service companies and independent suppliers of software products. Existing and potential financial institution clients could also develop and use their own in-house systems. In addition, we compete with vendors that offer similar transaction processing products and services to financial institutions, including Black Knight Financial Technology Solutions LLC, Computer Services, Inc., Finastra Limited, FIS, Infosys Ltd., International Business Machines Corporation, Jack Henry, Oracle Corporation, SAP SE and Temenos Group AG.
Government Regulation
The regulations that apply to the delivery of financial services are complex and evolve continuously. Except with respect to certain products and services, Fiserv and its subsidiaries are generally not directly subject to federal or state regulations applicable to financial institutions such as banks and credit unions. However, as a provider of services to these financial institutions, our operations are examined on a regular basis by various state and federal regulatory authorities and representatives of the Federal Financial Institutions Examination Council, which is a formal interagency body empowered to prescribe uniform principles, standards and report forms for the federal examination of financial institutions and to make recommendations to promote uniformity in the supervision of financial institutions. Also, state and federal regulations may require our financial institution clients to include certain provisions in their contracts with service providers like us, such as those related to security and privacy, and to conduct ongoing monitoring and risk management for third party relationships. In addition, independent auditors annually review many of our operations to provide internal control evaluations for our clients and their auditors.
In conducting our direct-to-consumer businesses, including our walk-in bill payment, online bill payment and Popmoney person-to-person payment services, we are directly subject to various federal and state laws, rules and regulations including those relating to the movement of money. In order to comply with our obligations under applicable laws, we are required, among other matters, to comply with licensing and reporting requirements, to implement operating policies and procedures necessary to comply with anti-money laundering laws, to comply with capital requirements, to protect the privacy and security of our clients’ information, and to undergo periodic audits and examinations.
Since the enactment of the Dodd-Frank Wall Street Reform and Consumer Protection Act (“Dodd-Frank Act”), there have been substantial reforms to the supervision and operation of the financial services industry, including numerous new regulations that have imposed compliance costs and, in some cases, limited revenue sources for us and our clients. Among other things, the Dodd-Frank Act established the Consumer Financial Protection Bureau (“CFPB”), which is empowered to conduct rule-making and supervision related to, and enforcement of, federal consumer financial protection laws. The CFPB has issued guidance that applies to, and conducts direct examinations of, “supervised banks and nonbanks” as well as “supervised service providers” like us. In addition, federal and state agencies have begun to propose and enact cybersecurity regulations, such as the Cybersecurity Requirements for Financial Services Companies issued by the New York State Department of Financial Services in 2017 and the Advance Notice of Proposed Rulemaking on Enhanced Cyber Risk Management Standards proposed by The Board of Governors of the Federal Reserve System, the Office of the Comptroller of the Currency and the Federal Deposit Insurance Corporation in 2016. New regulations could, among other things, require us to make significant additional investments to comply with them, modify our products or services or the manner in which they are provided, or limit or change the amount or types of revenue we are able to generate.
Employees
We have nearly 24,000 employees globally, many of whom are specialists in our information management centers and related product and service businesses. This service support network includes employees with backgrounds in computer science and the financial industry, as well as employees with direct experience in payments, financial institutions and other financial services environments. Our employees provide expertise in: programming, software development, modification and maintenance; computer operations, network control and technical support; client services and training; business process outsourcing; item and mortgage processing; system conversions; sales and marketing; and account management.
The service nature of our business makes our employees an important corporate asset. Although the market for qualified personnel is competitive, we have not experienced significant difficulty with hiring or retaining our staff of top industry professionals. In assessing a potential acquisition candidate, we emphasize the quality and stability of the acquisition candidate’s employees.
Available Information
Our website address is www.fiserv.com. We are not including the information provided on our website as a part of, or incorporating it by reference into, this Annual Report on Form 10-K. We make available free of charge (other than an investor’s own internet access charges) through our website our annual reports on Form 10-K, quarterly reports on Form 10-Q, current reports on Form 8-K, and amendments to these reports, as soon as reasonably practicable after we electronically file such material with, or furnish such material to, the Securities and Exchange Commission.
Item 1A. Risk Factors
You should carefully consider each of the risks described below, together with all of the other information contained in this Annual Report on Form 10-K, before making an investment decision with respect to our securities. If any of the following risks develop into actual events, our business, financial condition or results of operations could be materially and adversely affected and you may lose all or part of your investment.
We operate in a competitive business environment and may not be able to compete effectively.
The markets for our services are highly competitive from new and existing competitors. Our principal competitors include other vendors of financial services technology, data processing affiliates of large companies, and processing centers owned and operated as user cooperatives. Our competitors vary in size and in the scope and breadth of the services they offer. Many of our larger existing and potential clients have historically developed their key applications in-house. As a result, we often compete against our existing or potential clients’ in-house capabilities. We expect that the markets in which we compete will continue to attract new well-funded competitors and new technologies, including large technology, media and other companies not historically in the financial services industry, start-ups and international providers of similar products and services to ours. We cannot provide any assurance that we will be able to compete successfully against current or future competitors or that competitive pressures faced by us in the markets in which we operate will not materially and adversely affect our business, results of operations and financial condition.
If we fail to adapt our products and services to changes in technology or in the marketplace, or if our ongoing efforts to upgrade our technology are not successful, we could lose clients or have trouble attracting new clients, and our ability to grow may be limited.
The markets for our products and services are characterized by constant technological changes, frequent introductions of new products and services, and increasing client expectations. Our ability to enhance our current products and services and to develop and introduce innovative products and services that address the increasingly sophisticated needs of our clients and their customers will significantly affect our future success. We may not be successful in developing, marketing or selling new products and services that meet these demands or achieve market acceptance. In addition, the success of certain of our products and services rely, in part, on financial institutions, billers and other third parties to promote the use of our products and services by their customers. If we are unsuccessful in offering products or services that gain market acceptance, or if third parties insufficiently promote our products and services, it would likely have a material adverse effect on our ability to retain existing clients, to attract new ones and to grow profitably.
If we are unable to renew client contracts at favorable terms, we could lose clients and our results of operations and financial condition may be adversely affected.
Failure to achieve favorable renewals of client contracts could negatively impact our business. Our contracts with clients generally run for a period of three to five years. At the end of the contract term, clients have the opportunity to renegotiate their contracts with us or to consider whether to engage one or more of our competitors to provide products and services. If we are
not successful in achieving high renewal rates and favorable contract terms, our results of operations and financial condition may be materially and adversely affected.
Consolidations in the banking and financial services industry could adversely affect our revenue by eliminating existing or potential clients and making us more dependent on fewer clients.
Mergers, consolidations and failures of financial institutions reduce the number of our clients and potential clients, which could adversely affect our revenue. If our clients merge with or are acquired by other entities that are not our clients, or that use fewer of our services, they may discontinue or reduce their use of our services. It is also possible that the larger financial institutions that result from mergers or consolidations could have greater leverage in negotiating terms with us or could decide to perform in-house some or all of the services which we currently provide or could provide. Any of these developments could have a material adverse effect on our business, results of operations and financial condition.
Security breaches, computer malware or other “cyber attacks” could harm our business by disrupting our delivery of services and damaging our reputation.
Our operations depend on receiving, storing, processing and transmitting sensitive information pertaining to our business, our associates, our clients and their customers. Any unauthorized intrusion, malicious software infiltration, network disruption, denial of service or similar act could disrupt the integrity, continuity, security and trust of our systems or data, or the systems or data of our clients or vendors. These events could create costly litigation, significant financial liability, increased regulatory scrutiny, financial sanctions and a loss of confidence in our ability to serve clients and cause current or potential clients to choose another service provider, all of which could have a material adverse impact on our business. In addition, as these threats continue to evolve, we may be required to invest significant additional resources to modify and enhance our information security and controls or to investigate and remediate any security vulnerabilities. Although we believe that we maintain a robust program of information security and controls and none of the threats that we have encountered to date have materially impacted us, we may not be able to prevent a material event in the future, and the impact of a material event could have a material adverse effect on our business, results of operations and financial condition.
Operational failures could harm our business and reputation.
An operational failure could harm our business or cause us to lose clients. An operational failure could be caused by our actions or the actions of third parties, and could involve networks and systems upon which we rely to deliver our services and over which we have limited or no control. Interruptions of service could damage our relationship with clients and could cause us to incur substantial expenses, including those related to the payment of service credits or other liabilities. A prolonged interruption of our services or network could cause us to experience data loss or a reduction in revenue. In addition, a significant interruption of service could have a negative impact on our reputation and could cause our current and potential clients to choose another service provider. Any of these developments could have a material adverse impact on our business, results of operations and financial condition.
We may experience software defects, development delays or installation difficulties, which would harm our business and reputation and expose us to potential liability.
Our services are based on sophisticated software and computer systems, and we may encounter delays when developing new applications and services. Further, the software underlying our services may contain undetected errors or defects when first introduced or when new versions are released. In addition, we may experience difficulties in installing or integrating our technology on systems used by our clients. Defects in our software, errors or delays in the processing of electronic transactions or other difficulties could result in interruption of business operations, delay in market acceptance, additional development and remediation costs, diversion of technical and other resources, loss of clients, negative publicity or exposure to liability claims. Although we attempt to limit our potential liability through disclaimers and limitation of liability provisions in our license and client agreements, we cannot be certain that these measures will successfully limit our liability.
A heightened regulatory environment in the financial services industry may have an adverse impact on our clients and our business.
Since the enactment of the Dodd-Frank Wall Street Reform and Consumer Protection Act (“Dodd-Frank Act”), a number of substantial regulations affecting the supervision and operation of the financial services industry within the United States have been adopted, including those that establish the Consumer Financial Protection Bureau (“CFPB”). The CFPB has issued guidance that applies to, and conducts direct examinations of, “supervised banks and nonbanks” as well as “supervised service providers” like us. In addition, federal and state governments have adopted or are pursuing numerous additional regulations impacting the financial services industry, including regulations related to cybersecurity and data privacy. To the extent this oversight or regulation negatively impacts the business, operations or financial condition of our clients, our business and results
of operations could be materially and adversely affected because, among other matters, our clients could have less capacity to purchase products and services from us, could decide to avoid or abandon certain lines of business, or could seek to pass on increased costs to us by negotiating price reductions. Additional regulation, examination and oversight of us could require us to modify the manner in which we contract with or provide products and services to our clients; directly or indirectly limit how much we can charge for our services; require us to invest additional time and resources to comply with such oversight and regulations; or limit our ability to update our existing products and services, or require us to develop new ones. Any of these events, if realized, could have a material adverse effect on our business, results of operations and financial condition.
If we fail to comply with applicable regulations, our businesses could be harmed.
If we fail to comply with regulations applicable to our business, including data privacy regulations, we could be exposed to litigation or regulatory proceedings, our client relationships and reputation could be harmed, and we could be inhibited in our ability to obtain new clients, which could have a material adverse impact on our business, results of operations and financial condition. In addition, the future enactment of more restrictive laws or rules on the federal or state level, or, with respect to our international operations, in foreign jurisdictions on the national, provincial, state or other level, could have a material adverse impact on our business, results of operations and financial condition.
Our failure to comply with a series of complex regulations in our payments businesses could subject us to liability.
Certain of our subsidiaries are licensed as money transmitters in those states where such licensure is required. In connection with such licensure, we are required to demonstrate and maintain certain levels of net worth and liquidity and to file periodic reports. In addition, our direct-to-consumer payments businesses, including our walk-in bill payment, online bill payment and Popmoney person-to-person payment services, are subject to federal regulation in the United States, including anti-money laundering regulations and certain restrictions on transactions to or from certain individuals or entities. The complexity of these regulations will continue to increase our cost of doing business. In addition, any violations of law may result in civil or criminal penalties against us and our officers, or the prohibition against us providing money transmitter services in particular jurisdictions.
If we fail to comply with the applicable requirements of the payment card networks, they could seek to fine us, suspend us or terminate our registrations which could adversely affect our business.
We are subject to card association and network rules governing Visa, MasterCard, American Express, Discover or other similar organizations, including the Payment Card Industry Data Security Standard enforced by the major card brands. The rules of the card networks are set by their boards which may be influenced by card issuers, some of which offer competing transaction processing services. If we fail to comply with these rules, we could be fined, our certifications could be suspended, or our certifications could be terminated. The suspension or termination of our certifications, or any changes to the card association and network rules, that we do not successfully address could limit our ability to provide transaction processing services to clients and result in a reduction of revenue or increased costs of operation, which, in either case, could have a material adverse effect on our business and results of operations.
We may be sued for infringing the intellectual property rights of others.
Third parties may claim that we are infringing their intellectual property rights. We may expose ourselves to additional liability if we agree to indemnify our clients against third party infringement claims. If the owner of intellectual property establishes that we are, or a client which we are obligated to indemnify is, infringing its intellectual property rights, we may be forced to change our products or services, and such changes may be expensive or impractical, or we may need to seek royalty or license agreements from the owner of such rights. If we are unable to agree on acceptable terms, we may be required to discontinue the sale of key products or halt other aspects of our operations. We may also be liable for financial damages for a violation of intellectual property rights, and we may incur expenses in connection with indemnifying our clients against losses suffered by them. Any adverse result related to violation of third party intellectual property rights could materially and adversely harm our business, results of operations and financial condition. Even if intellectual property claims brought against us are without merit, they may result in costly and time-consuming litigation and may require significant attention from our management and key personnel.
Misappropriation of our intellectual property and proprietary rights could impair our competitive position.
Our ability to compete depends upon proprietary systems and technology. We actively seek to protect our proprietary rights. Nevertheless, unauthorized parties may attempt to copy aspects of our services or to obtain and use information that we regard as proprietary. The steps we have taken may not prevent misappropriation of technology. Agreements entered into for that purpose may not be enforceable or provide us with an adequate remedy. Effective patent, trademark, service mark, copyright and trade secret protection may not be available in every country in which our applications and services are made available.
Misappropriation of our intellectual property or potential litigation concerning such matters could have a material adverse effect on our business, results of operations and financial condition.
Acquisitions subject us to risks, including increased debt, assumption of unforeseen liabilities and difficulties in integrating operations.
A major contributor to our growth in revenue and earnings since our inception has been our ability to identify, acquire and integrate complementary businesses. We anticipate that we will continue to seek to acquire complementary businesses, products and services. We may not be able to identify suitable acquisition candidates or complete acquisitions in the future, which could adversely affect our future growth; or businesses that we acquire may not perform as well as expected or may be more difficult to integrate and manage than expected, which could adversely affect our business and results of operations. We may not be able to integrate all aspects of acquired businesses successfully or realize the potential benefits of bringing them together. In addition, the process of integrating these acquisitions may disrupt our business and divert our resources.
These risks may arise for a number of reasons: we may not be able to find suitable businesses to acquire at affordable valuations or on other acceptable terms; we may face competition for acquisitions from other potential acquirers; we may need to borrow money or sell equity or debt securities to the public to finance future acquisitions and the terms of these financings may be adverse to us; changes in accounting, tax, securities or other regulations could increase the difficulty or cost for us to complete acquisitions; we may incur unforeseen obligations or liabilities in connection with acquisitions; we may need to devote unanticipated financial and management resources to an acquired business; we may not realize expected operating efficiencies or product integration benefits from an acquisition; we could enter markets where we have minimal prior experience; and we may experience decreases in earnings as a result of non-cash impairment charges.
We may be obligated to indemnify the purchasers of businesses pursuant to the terms of the relevant purchase and sale agreements.
We have in the past and may in the future sell businesses. In connection with sales of businesses, we may make representations and warranties about the businesses and their financial affairs and agree to retain certain liabilities associated with our operation of the businesses prior to their sale. Our obligation to indemnify the purchasers and agreement to retain liabilities could have a material adverse effect on our business, results of operations and financial condition.
The failure to attract and retain key personnel could have a material adverse effect on our business.
We depend on the experience, skill and contributions of our senior management and other key employees. If we fail to attract, motivate and retain highly qualified management, technical, compliance and sales personnel, our future success could be harmed. Our senior management provides strategic direction for our company, and if we lose members of our leadership team, our management resources may have to be diverted from other priorities to address this loss. Our products and services require sophisticated knowledge of the financial services industry, applicable regulatory and industry requirements, computer systems, and software applications, and if we cannot hire or retain the necessary skilled personnel, we could suffer delays in new product development, experience difficulty complying with applicable requirements or otherwise fail to satisfy our clients’ demands.
Our business may be adversely impacted by U.S. and global market and economic conditions.
For the foreseeable future, we expect to continue to derive most of our revenue from products and services we provide to the financial services industry. Given this concentration, we are exposed to the global economic conditions in the financial services industry. A prolonged poor economic environment could result in significant decreases in demand by current and potential clients for our products and services and in the number and dollar amount of transactions we process, which could have a material adverse effect on our business, results of operations and financial condition.
The market for our electronic transaction services continues to evolve and may not continue to develop or grow rapidly enough to sustain profitability.
If the number of electronic transactions does not continue to grow, or if consumers or businesses do not continue to adopt our services, it could have a material adverse effect on our business, results of operations and financial condition. We believe future growth in the electronic transactions market will be driven by a combination of factors including speed, cost, ease-of-use, security and quality of products and services offered to consumers and businesses.
New guidance or further analysis of the newly enacted U.S. tax reform legislation could cause us to modify current estimates about the impact that it will have on us, which could negatively impact our anticipated earnings and have an adverse effect on our results of operations and cash flow.
On December 22, 2017, the U.S. government enacted comprehensive tax legislation commonly referred to as the Tax Cuts and Jobs Act (the “Tax Act”). The Tax Act significantly revises the U.S. corporate income tax code by, among other things, lowering corporate income tax rates, implementing a territorial-style tax system and imposing a repatriation tax on deemed repatriated earnings of foreign subsidiaries. With the enactment of the Tax Act, our financial results for 2017 included a reduction of income tax expense of approximately $275 million resulting primarily from the re-evaluation of our deferred tax assets and liabilities to reflect the recently enacted 21 percent U.S. federal corporate tax rate and the deemed repatriation tax on untaxed accumulated foreign earnings. These estimates are based on our initial analysis of the Tax Act. Further analysis of this complex legislation or future guidance from the Internal Revenue Service, the Securities and Exchange Commission or the Financial Accounting Standards Board could cause us to adjust current estimates in future periods, which could impact our earnings and have an adverse effect on our results of operations and cash flow.
Our balance sheet includes significant amounts of goodwill and intangible assets. The impairment of a significant portion of these assets would negatively affect our results of operations.
Our balance sheet includes goodwill and intangible assets that represent 73% of our total assets at December 31, 2017. These assets consist primarily of goodwill and identified intangible assets associated with our acquisitions. On at least an annual basis, we assess whether there have been impairments in the carrying value of goodwill. In addition, we review intangible assets for impairment whenever events or changes in circumstances indicate the carrying amount of the asset may not be recoverable. If the carrying value of the asset is determined to be impaired, then it is written down to fair value by a charge to operating earnings. An impairment of a significant portion of goodwill or intangible assets could have a material negative effect on our results of operations.
Increased leverage may harm our financial condition and results of operations.
As of December 31, 2017, we had approximately $4.9 billion of debt. We and our subsidiaries may incur additional indebtedness in the future. Our indebtedness could: decrease our ability to obtain additional financing for working capital, capital expenditures, general corporate or other purposes; limit our flexibility to make acquisitions; increase our cash requirements to support the payment of interest; limit our flexibility in planning for, or reacting to, changes in our business and our industry; and increase our vulnerability to adverse changes in general economic and industry conditions. Our ability to make payments of principal and interest on our indebtedness depends upon our future performance, which will be subject to general economic conditions and financial, business and other factors affecting our consolidated operations, many of which are beyond our control. In addition, if our outstanding senior notes are downgraded to below investment grade, we may incur additional interest expense. If we are unable to generate sufficient cash flow from operations in the future to service our debt and meet our other cash requirements, we may be required, among other things: to seek additional financing in the debt or equity markets; to refinance or restructure all or a portion of our indebtedness; or to reduce or delay planned capital or operating expenditures. Such measures might not be sufficient to enable us to service our debt and meet our other cash requirements. In addition, any such financing, refinancing or sale of assets might not be available at all or on economically favorable terms.
Item 1B. Unresolved Staff Comments
None.
Item 2. Properties
As of December 31, 2017, we operated data, development, item processing and support centers in approximately 105 cities. We owned five buildings, and the more than 120 remaining locations where we operated our businesses are subject to leases. We believe that the facilities and equipment that we own and lease are well maintained, are in good operating condition, and are adequate for our business needs. However, we may choose to combine existing operations to enhance business integration. We maintain our own, and contract with multiple service providers to provide, processing back-up in the event of a disaster. We also maintain copies of data and software used in our business in locations that are separate from our facilities.
Item 3. Legal Proceedings
In the normal course of business, we or our subsidiaries are named as defendants in lawsuits in which claims are asserted against us. In the opinion of management, the liabilities, if any, which may ultimately result from such lawsuits are not expected to have a material adverse effect on our consolidated financial statements.
Item 4. Mine Safety Disclosures
Not applicable.
EXECUTIVE OFFICERS OF THE REGISTRANT
The names of our executive officers as of February 22, 2018, together with their ages, positions and business experience are described below:
|
| | |
Name | Age | Title |
Jeffery W. Yabuki | 57 | President, Chief Executive Officer and Director |
Mark A. Ernst | 59 | Chief Operating Officer |
Robert W. Hau | 52 | Chief Financial Officer and Treasurer |
Lynn S. McCreary | 58 | Chief Legal Officer and Secretary |
Devin B. McGranahan | 48 | Group President, Billing and Payments Group |
Kevin J. Schultz | 60 | Group President, Digital Banking Group |
Byron C. Vielehr | 54 | Group President, Depository Institution Services Group |
Mr. Yabuki has been a director and our President and Chief Executive Officer since 2005. Before joining Fiserv, Mr. Yabuki served as executive vice president and chief operating officer of H&R Block, Inc., a financial services firm, from 2002 to 2005. From 2001 to 2002, he served as executive vice president of H&R Block and from 1999 to 2001, he served as the president of H&R Block International. From 1987 to 1999, Mr. Yabuki held various executive positions with the American Express Company, a financial services firm, including president and chief executive officer of American Express Tax and Business Services, Inc.
Mr. Ernst has served as Chief Operating Officer since 2011. Prior to joining Fiserv, he served as deputy commissioner for operations support for the Internal Revenue Service from 2009 to 2010, where he was responsible for technology, operations, shared services, human resources and the chief financial office. From 2008 to 2009, he was chief executive officer of Bellevue Capital LLC, a private investment firm; from 2001 to 2007, he served as chairman, president and chief executive officer of H&R Block, Inc., a financial services firm; and from 1998 to 2000, he served as its chief operating officer. His experience, which includes executive positions with the American Express Company, a financial services firm, spans more than 30 years in the financial services industry. On February 5, 2018, Mr. Ernst informed us that he intends to retire on April 1, 2018.
Mr. Hau has served as Chief Financial Officer since 2016. Before joining Fiserv, Mr. Hau served as executive vice president and chief financial officer at TE Connectivity Ltd., a global technology company that designs and manufactures highly engineered connectivity and sensor products, from 2012 to 2016. From 2009 to 2012, he served as executive vice president and chief financial officer at Lennox International Inc., a provider of products and services in the heating, air conditioning, and refrigeration markets; and from 2006 to 2009, he served as vice president and chief financial officer for the aerospace business group of Honeywell International, Inc., a technology and manufacturing company. Mr. Hau joined Honeywell (initially AlliedSignal) in 1987 and served in a variety of senior financial leadership positions, including vice president and chief financial officer for the company’s aerospace electronic systems unit and for its specialty materials business group.
Ms. McCreary has served as Chief Legal Officer and Secretary since 2013. Ms. McCreary joined Fiserv in 2010 as senior vice president and deputy general counsel. Prior to joining Fiserv, Ms. McCreary was an attorney with the law firm of Bryan Cave LLP from 1996 to 2010, including serving as managing partner of its San Francisco, California office from its opening in 2008 to 2010. Ms. McCreary began her career in financial services with positions at Citicorp Person-to-Person and Metropolitan Life Insurance Company’s mortgage subsidiary, Metmor Financial, Inc.
Mr. McGranahan has served as Group President, Billing and Payments Group, since 2016. Before joining Fiserv, Mr. McGranahan served as a senior partner at McKinsey & Company, a global management consulting firm. While there, he held a variety of senior management roles at the firm, including leader of the global insurance practice from 2013 to 2016 and co-chair of the global senior partner election committee from 2013 to 2015. In addition, Mr. McGranahan served as co-leader of the North America financial services practice from 2009 to 2016. He joined McKinsey in 1992 and served in a variety of other leadership positions prior to 2009, including leader of the North American property and casualty practice and managing partner of the Pittsburgh office.
Mr. Schultz has served as Group President, Digital Banking Group, since 2014. Prior to joining Fiserv, Mr. Schultz served as president of global financial services at First Data Corporation, a global payment processing company, from 2009 to 2011, and as global head of processing services at Visa Inc. from 2007 to 2009. He has more than 30 years of experience in the payments
and financial services industry, including a variety of other senior leadership roles at Visa Inc. and Global Payments Inc., an electronic transaction processing service provider.
Mr. Vielehr has served as Group President, Depository Institution Services Group, since 2013. Prior to joining Fiserv, Mr. Vielehr served in a succession of senior executive positions with The Dun & Bradstreet Corporation, a provider of commercial information and business insight solutions, from 2005 to 2013, most recently as president of international and global operations. He also previously served as president and chief operating officer of Northstar Systems International, Inc., a developer of wealth management software (now part of SEI Investments Company), from 2004 to 2005. Mr. Vielehr has more than 25 years of experience in the financial services and technology industries, including a variety of executive leadership roles at Merrill Lynch and Strong Capital Management.
PART II
| |
Item 5. | Market for Registrant’s Common Equity, Related Stockholder Matters and Issuer Purchases of Equity Securities |
Market Price Information
Our common stock is traded on the NASDAQ Global Select Market under the symbol “FISV.” Set forth below is the high and low sales price of our common stock during the periods presented.
|
| | | | | | | | | | | | | | | | |
| | 2017 | | 2016 |
Quarter Ended | | High | | Low | | High | | Low |
March 31 | | $ | 118.30 |
| | $ | 104.51 |
| | $ | 102.88 |
| | $ | 85.63 |
|
June 30 | | 127.10 |
| | 114.95 |
| | 108.85 |
| | 96.34 |
|
September 30 | | 129.61 |
| | 119.70 |
| | 111.51 |
| | 97.73 |
|
December 31 | | 133.36 |
| | 120.38 |
| | 109.11 |
| | 92.81 |
|
At December 31, 2017, our common stock was held by 1,883 shareholders of record and by a significantly greater number of shareholders who hold shares in nominee or street name accounts with brokers. The closing price of our common stock on February 16, 2018 was $142.72 per share. We have never paid dividends on our common stock, and we do not anticipate paying dividends in the foreseeable future. For additional information regarding our expected use of capital, refer to the discussion in this report under the heading “Management’s Discussion and Analysis of Financial Condition and Results of Operations – Liquidity and Capital Resources.”
Issuer Purchases of Equity Securities
The table below sets forth information with respect to purchases made by or on behalf of us or any “affiliated purchaser” (as defined in Rule 10b-18(a)(3) under the Securities Exchange Act of 1934) of shares of our common stock during the three months ended December 31, 2017:
|
| | | | | | | | | | | | | |
Period | | Total Number of Shares Purchased | | Average Price Paid per Share | | Total Number of Shares Purchased as Part of Publicly Announced Plans or Programs (1) | | Maximum Number of Shares that May Yet Be Purchased Under the Plans or Programs (1) |
October 1-31, 2017 | | 545,000 |
| | $ | 128.07 |
| | 545,000 |
| | 11,658,000 |
|
November 1-30, 2017 | | 520,000 |
| | 127.96 |
| | 520,000 |
| | 11,138,000 |
|
December 1-31, 2017 | | 400,000 |
| | 131.39 |
| | 400,000 |
| | 10,738,000 |
|
Total | | 1,465,000 |
| |
| | 1,465,000 |
| |
|
_____
| |
(1) | On November 16, 2016, our board of directors authorized the purchase of up to 15.0 million shares of our common stock. This authorization does not expire. |
Stock Performance Graph
The stock performance graph and related information presented below is not deemed to be “soliciting material” or to be “filed” with the Securities and Exchange Commission or subject to Regulation 14A or 14C under the Securities Exchange Act of 1934 or to the liabilities of Section 18 of the Securities Exchange Act of 1934 and will not be deemed to be incorporated by reference into any filing under the Securities Act of 1933 or the Securities Exchange Act of 1934, except to the extent we specifically incorporate it by reference into such a filing.
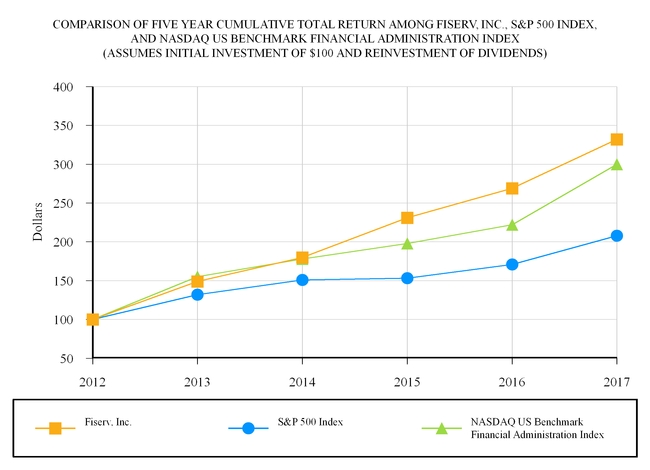
The following graph compares the cumulative total shareholder return on our common stock for the five years ended December 31, 2017 with the S&P 500 Index and the NASDAQ US Benchmark Financial Administration Index. The graph assumes that $100 was invested on December 31, 2012 in our common stock and each index and that all dividends were reinvested. No cash dividends have been declared on our common stock. The comparisons in the graph are required by the Securities and Exchange Commission and are not intended to forecast or be indicative of possible future performance of our common stock.
|
| | | | | | | | | | | | | | | | | | | | | | | |
| December 31, |
| 2012 | | 2013 | | 2014 | | 2015 | | 2016 | | 2017 |
Fiserv, Inc. | $ | 100 |
| | $ | 149 |
| | $ | 180 |
| | $ | 231 |
| | $ | 269 |
| | $ | 332 |
|
S&P 500 Index | 100 |
| | 132 |
| | 151 |
| | 153 |
| | 171 |
| | 208 |
|
NASDAQ US Benchmark Financial Administration Index | 100 |
| | 155 |
| | 178 |
| | 198 |
| | 222 |
| | 300 |
|
Item 6. Selected Financial Data
The following data should be read in conjunction with the consolidated financial statements and accompanying notes included elsewhere in this Annual Report on Form 10-K. The selected historical data presented below has been affected by acquisitions and dispositions, transactional gains recorded by our unconsolidated affiliate, debt extinguishment and refinancing activities, and by the Tax Cuts and Jobs Act enacted in December 2017. In addition, total assets and long-term debt have been adjusted on a retrospective basis for the adoption of Accounting Standards Update (“ASU”) No. 2015-17, Balance Sheet Classification of Deferred Taxes, and ASU No. 2015-03, Simplifying the Presentation of Debt Issuance Costs effective December 31, 2015. Accordingly, current deferred tax assets have been reclassified to noncurrent assets and liabilities, and certain debt issuance costs previously included within other long-term assets have been reclassified as a reduction in long-term debt.
|
| | | | | | | | | | | | | | | | | | | |
(In millions, except per share data) | 2017 | | 2016 | | 2015 | | 2014 | | 2013 |
Total revenue | $ | 5,696 |
| | $ | 5,505 |
| | $ | 5,254 |
| | $ | 5,066 |
| | $ | 4,814 |
|
Income from continuing operations | $ | 1,232 |
| | $ | 930 |
| | $ | 712 |
| | $ | 754 |
| | $ | 650 |
|
Income (loss) from discontinued operations | 14 |
| | — |
| | — |
| | — |
| | (2 | ) |
Net income | $ | 1,246 |
| | $ | 930 |
| | $ | 712 |
| | $ | 754 |
| | $ | 648 |
|
| | | | | | | | | |
Net income (loss) per share - basic: | | | | | | | | | |
Continuing operations | $ | 5.84 |
| | $ | 4.22 |
| | $ | 3.04 |
| | $ | 3.04 |
| | $ | 2.48 |
|
Discontinued operations | 0.07 |
| | — |
| | — |
| | — |
| | (0.01 | ) |
Total | $ | 5.90 |
| | $ | 4.22 |
| | $ | 3.04 |
| | $ | 3.03 |
| | $ | 2.47 |
|
| | | | | | | | | |
Net income (loss) per share - diluted: | | | | | | | | | |
Continuing operations | $ | 5.71 |
| | $ | 4.15 |
| | $ | 2.99 |
| | $ | 2.99 |
| | $ | 2.44 |
|
Discontinued operations | 0.07 |
| | — |
| | — |
| | — |
| | (0.01 | ) |
Total | $ | 5.78 |
| | $ | 4.15 |
| | $ | 2.99 |
| | $ | 2.98 |
| | $ | 2.44 |
|
| | | | | | | | | |
Total assets | $ | 10,289 |
| | $ | 9,743 |
| | $ | 9,340 |
| | $ | 9,308 |
| | $ | 9,466 |
|
Long-term debt (including current maturities) | 4,900 |
| | 4,562 |
| | 4,293 |
| | 3,790 |
| | 3,831 |
|
Shareholders’ equity | 2,731 |
| | 2,541 |
| | 2,660 |
| | 3,295 |
| | 3,585 |
|
Item 7. Management’s Discussion and Analysis of Financial Condition and Results of Operations
Management’s discussion and analysis of financial condition and results of operations is provided as a supplement to our consolidated financial statements and accompanying notes to help provide an understanding of our financial condition, the changes in our financial condition and our results of operations. Our discussion is organized as follows:
| |
• | Overview. This section contains background information on our company and the services and products that we provide, acquisitions and dispositions, our enterprise priorities, and the trends affecting our industry in order to provide context for management’s discussion and analysis of our financial condition and results of operations. |
| |
• | Critical accounting policies and estimates. This section contains a discussion of the accounting policies that we believe are important to our financial condition and results of operations and that require judgment and estimates on the part of management in their application. In addition, all of our significant accounting policies, including critical accounting policies, are summarized in Note 1 to the accompanying consolidated financial statements. |
| |
• | Results of operations. This section contains an analysis of our results of operations presented in the accompanying consolidated statements of income by comparing the results for the year ended December 31, 2017 to the results for the year ended December 31, 2016 and by comparing the results for the year ended December 31, 2016 to the results for the year ended December 31, 2015. |
| |
• | Liquidity and capital resources. This section provides an analysis of our cash flows and a discussion of our outstanding debt and commitments at December 31, 2017. |
Overview
Company Background
We are a leading global provider of financial services technology. We provide account processing systems, electronic payments processing products and services, internet and mobile banking systems, and related services. We serve over 12,000 clients worldwide, including banks, savings banks, credit unions, investment management firms, leasing and finance companies, billers, retailers, merchants, and building societies. The majority of our revenue is generated from recurring account- and transaction-based fees under contracts that generally have terms of three to five years and high renewal rates. Most of the services we provide are necessary for our clients to operate their businesses and are, therefore, non-discretionary in nature.
Our operations are principally located in the United States and are comprised of the Payments and Industry Products (“Payments”) segment and the Financial Institution Services (“Financial”) segment. The Payments segment primarily provides electronic bill payment and presentment services, internet and mobile banking software and services, account-to-account transfers, person-to-person payment services, debit and credit card processing and services, payments infrastructure services, and other electronic payments software and services. Our businesses in this segment also provide card and print personalization services, investment account processing services for separately managed accounts, and fraud and risk management products and services. The Financial segment provides banks, credit unions, and leasing and finance companies with account processing services, item processing and source capture services, loan origination and servicing products, cash management and consulting services, and other products and services that support numerous types of financial transactions. Corporate and Other primarily consists of unallocated corporate expenses including share-based compensation, amortization of acquisition-related intangible assets, intercompany eliminations and other costs that are not considered when management evaluates segment performance.
Acquisitions and Dispositions
We frequently review our portfolio to ensure we have the right set of businesses to execute on our strategy. We expect to acquire businesses when we identify: a compelling strategic need, such as a product, service or technology that helps meet client demand; an opportunity to change industry dynamics; a way to achieve business scale; or similar considerations. We expect to divest businesses that are not in line with our market, product or financial strategies.
During 2017, we completed four acquisitions for an aggregate purchase price of $384 million, net of $33 million of acquired cash, along with earn-out provisions estimated at a fair value of $15 million. In January 2017, we completed our acquisition of Online Banking Solutions, Inc. (“OBS”), a provider of cash management and digital business banking solutions that complement and enrich our existing solutions. In July 2017, we acquired the assets of PCLender, LLC (“PCLender”), a leader in internet-based mortgage software and mortgage lending technology solutions. The OBS and PCLender acquisitions are included in the Financial segment as their products are integrated across a number of our account processing solutions and will enable our bank and credit union clients to better serve their commercial and mortgage customers. In August 2017, we acquired Dovetail Group Limited (“Dovetail”), a leading provider of bank payments and liquidity management solutions. In September 2017, we completed our acquisition of Monitise plc (“Monitise”), a provider of digital solutions that enables innovative digital banking experiences for leading financial institutions worldwide. The Dovetail and Monitise acquisitions are included in the Payments segment and will further enable us to help financial institutions around the world transform their payments infrastructure and to expand our digital leadership, respectively.
In 2016, we acquired the Convenience Pay Services business of Hewlett Packard Enterprise Company and completed our purchase of the Community Financial Services business of ACI Worldwide, Inc. for an aggregate purchase price of $265 million. These acquisitions expand our biller solution offerings and enhance our suite of digital banking and payments solutions, and are included in the Payments segment.
In May 2017, we sold our Australian item processing business, which was reported within the Financial segment, for approximately $17 million, and, in January 2018, we completed the sale of the retail voucher business acquired in our 2017 acquisition of Monitise for proceeds of £37 million ($50 million). In addition, in February 2018, we announced a definitive agreement to sell a 55% interest of our lending solutions business, which is reported within the Financial segment, retaining a 45% interest in the joint venture.
During 2017 and 2015, StoneRiver Group, L.P. (“StoneRiver”), a joint venture in which we own a 49% interest and account for under the equity method, recognized net gains on the sales of subsidiary businesses, and in 2016, recognized a net gain on the sale of a business interest. Our pre-tax share of the net gains and related expenses on these transactions was $26 million in 2017, $146 million in 2016 and $29 million in 2015, with related tax expenses of $9 million, $54 million and $13 million, respectively. In addition, we received cash dividends of $45 million, $151 million and $36 million in 2017, 2016 and 2015, respectively, from StoneRiver, which were funded from the sale transactions.
Enterprise Priorities
We continue to implement a series of strategic initiatives to help accomplish our mission of providing integrated technology and services solutions that enable best-in-class results for our clients. These strategic initiatives include active portfolio management of our businesses, enhancing the overall value of our existing client relationships, improving operational effectiveness, being disciplined in our allocation of capital, and differentiating our products and services through innovation. Our key enterprise priorities for 2018 are: (i) to continue to build high-quality revenue while meeting our earnings goals; (ii) to enhance client relationships with an emphasis on digital and payment solutions; and (iii) to deliver innovation and integration which enables differentiated value for our clients.
Industry Trends
The market for products and services offered by financial institutions continues to evolve rapidly. The traditional financial industry and other market entrants regularly introduce and implement new payment, deposit, lending, investment and risk management products, and the distinctions among the products and services traditionally offered by different types of financial institutions continue to narrow as they seek to serve the same customers. At the same time, regulatory conditions and cybersecurity scrutiny have continued to create a challenging operating environment for financial institutions. For example, legislation such as the Dodd-Frank Wall Street Reform and Consumer Protection Act has generated, and may continue to generate, new regulations impacting the financial industry. These conditions, along with mild economic improvement, have created heightened interest in solutions that help financial institutions win and retain customers, generate incremental revenue, comply with regulations and enhance operating efficiency. Examples of these solutions include our electronic payments solutions and channels such as internet, mobile and tablet banking, sometimes referred to as “digital channels.”
This increased focus on digital channels by both financial institutions and their customers, as well as the growing volume and types of payment transactions in the marketplace, have increased the data and transaction processing needs of financial institutions. We expect that financial institutions will continue to invest significant capital and human resources to process transactions, manage information, maintain regulatory compliance and offer innovative new services to their customers in this rapidly evolving and competitive environment. We anticipate that we will benefit over the long term from the trend of financial institutions moving from in-house technology to outsourced solutions as they seek to remain current on technology changes in an evolving marketplace. We believe that economies of scale in developing and maintaining the infrastructure, technology, products, services and networks necessary to be competitive in such an environment are essential to justify these investments, and we anticipate that demand for products that facilitate customer interaction with financial institutions, including electronic transactions through digital channels, will continue to increase, which we expect to create revenue opportunities for us. Based on these market conditions, we believe that our sizable and diverse client base, combined with our position as a leading provider of non-discretionary, recurring revenue-based products and services, gives us a solid foundation for growth. Furthermore, we believe that the integration of our products and services creates a compelling value proposition for our clients.
In addition to the trends described above, the financial institutions marketplace has experienced change in composition as well. During the past 25 years, the number of financial institutions in the United States has declined at a relatively steady rate of approximately 3% per year, primarily as a result of voluntary mergers and acquisitions. Rather than reducing the overall market, these consolidations have transferred accounts among financial institutions. An acquisition benefits us when a newly combined institution is processed on our system, or elects to move to one of our systems, and negatively impacts us when a competing system is selected. Financial institution acquisitions also impact our financial results due to early contract termination fees in our multi-year client contracts, which are primarily generated when an existing client with a multi-year contract is acquired by another financial institution. These fees can vary from period to period based on the number and size of clients that are acquired and how early in the contract term the contract is terminated. Our revenue is diversified, and our focus on long-term client relationships and recurring, transaction-oriented products and services has reduced the impact that consolidation in the financial services industry has had on us. We have clients that span the entire range of financial institutions in terms of asset size and business model, and our 50 largest financial institution clients represent less than 25% of our annual revenue. In addition, we believe that our products and services can assist financial institutions with the regulatory and market challenges that they currently face by providing, among other things, new sources of revenue and opportunities to reduce their costs.
Critical Accounting Policies and Estimates
Our consolidated financial statements and accompanying notes have been prepared in accordance with accounting principles generally accepted in the United States, which require management to make estimates, judgments and assumptions that affect the reported amount of assets, liabilities, revenue and expenses. We continually evaluate the accounting policies and estimates that we use to prepare our consolidated financial statements and base our estimates on historical experience and assumptions
that we believe are reasonable in light of current circumstances. Actual amounts and results could differ materially from these estimates.
Acquisitions
From time to time, we make strategic acquisitions that may have a material impact on our consolidated results of operations or financial position. We allocate the purchase price of acquired businesses to the assets acquired and liabilities assumed in the transaction at their estimated fair values. The estimates used to determine the fair value of long-lived assets, such as intangible assets, can be complex and require significant judgments. We use information available to us to make fair value determinations and engage independent valuation specialists, when necessary, to assist in the fair value determination of significant acquired long-lived assets. While we use our best estimates and assumptions as a part of the purchase price allocation process, our estimates are inherently uncertain and subject to refinement. As a result, during the measurement period, which may be up to one year from the acquisition date, we record adjustments to the assets acquired and liabilities assumed, with the corresponding offset to goodwill. Upon the conclusion of the measurement period or final determination of the values of assets acquired or liabilities assumed, whichever comes first, any subsequent adjustments are recorded to our consolidated statements of income. We are also required to estimate the useful lives of intangible assets to determine the amount of acquisition-related intangible asset amortization expense to record in future periods. We periodically review the estimated useful lives assigned to our intangible assets to determine whether such estimated useful lives continue to be appropriate.
Goodwill and Acquired Intangible Assets
We review the carrying value of goodwill for impairment annually, or more frequently if events or circumstances indicate the carrying value may not be recoverable. Goodwill is tested for impairment at a reporting unit level, determined to be at an operating segment level or one level below. When reviewing goodwill for impairment, we consider the amount of excess fair value over the carrying value of each reporting unit, the period of time since a reporting unit’s last quantitative test, the extent a reorganization or disposition changes the composition of one or more of our reporting units, and other factors to determine whether or not to first perform a qualitative test. When performing a qualitative test, we assess numerous factors to determine whether it is more likely than not that the fair value of our reporting units are less than their respective carrying values. Examples of qualitative factors that we assess include our share price, our financial performance, market and competitive factors in our industry, and other events specific to our reporting units. If we conclude that it is more likely than not that the fair value of a reporting unit is less than its carrying value, we perform a quantitative impairment test.
The quantitative impairment test compares the fair value of the reporting unit to its carrying value, and recognizes an impairment loss for the amount by which a reporting unit’s carrying amount exceeds its fair value, without exceeding the total amount of goodwill allocated to that reporting unit. We determine the fair value of a reporting unit based primarily on the present value of estimated future cash flows. Determining the fair value of a reporting unit involves judgment and the use of significant estimates and assumptions, which include assumptions regarding the revenue growth rates and operating margins used to calculate estimated future cash flows, risk-adjusted discount rates, and future economic and market conditions.
Our most recent impairment assessment in the fourth quarter of 2017 determined that our goodwill was not impaired. The estimated fair values of the respective reporting units substantially exceeded the carrying values, except for recently acquired reporting units that approximated or exceeded the carrying values to a lesser magnitude given the short passage of time between the recent acquisition dates and when we performed our most recent annual impairment assessment.
We review acquired intangible assets for impairment whenever events or changes in circumstances indicate the carrying amount of the asset may not be recoverable. Recoverability is assessed by comparing the carrying amount of the asset to the undiscounted future cash flows expected to be generated by the asset. Measurement of any impairment loss is based on estimated fair value. Given the significance of our goodwill and intangible asset balances, an adverse change in fair value could result in an impairment charge, which could be material to our consolidated financial statements.
Revenue Recognition
The majority of our revenue is generated from monthly account- and transaction-based fees. Revenue is recognized as services are provided and is primarily recognized under service agreements that are long-term in nature, generally three to five years, and that do not require management to make significant judgments or assumptions. At times, however, judgment is exercised in evaluating revenue recognition, such as when a contract arrangement includes multiple product and service deliverables. Due to the quantity, size and nature of our multiple element arrangements, the judgments we make in this regard are not likely to have a material impact on revenue recognition for any individual element. Additionally, given the nature of our business and the rules governing revenue recognition, our revenue recognition practices generally do not involve significant estimates that materially affect our results of operations. Additional information about our revenue recognition policies is included in Note 1 to the consolidated financial statements.
Results of Operations
Components of Revenue and Expenses
The following summary describes the components of revenue and expenses as presented in our consolidated statements of income.
Processing and Services
Processing and services revenue, which in 2017 represented 85% of our total revenue, is primarily generated from account- and transaction-based fees under contracts that generally have terms of three to five years. Revenue is recognized when the related transactions are processed and services have been performed. Processing and services revenue is most reflective of our business performance as a significant amount of our total operating profit is generated by these services. Cost of processing and services includes costs directly associated with providing services to clients and includes the following: personnel; equipment and data communication; infrastructure costs, including costs to maintain software applications; client support; depreciation and amortization; and other operating expenses.
Product
Product revenue, which in 2017 represented 15% of our total revenue, is primarily derived from integrated print and card production sales, as well as software license sales which represented less than 4% of our total revenue. Cost of product includes costs directly associated with the products sold and includes the following: costs of materials and software development; personnel; infrastructure costs; depreciation and amortization; and other costs directly associated with product revenue.
Selling, General and Administrative Expenses
Selling, general and administrative expenses primarily consist of: salaries, wages, commissions and related expenses paid to sales personnel, administrative employees and management; advertising and promotional costs; depreciation and amortization; and other selling and administrative expenses.
Financial Results
The following table presents certain amounts included in our consolidated statements of income, the relative percentage that those amounts represent to revenue and the change in those amounts from year to year. This information should be read together with the consolidated financial statements and accompanying notes.
|
| | | | | | | | | | | | | | | | | | | | | | | | | | | | | | | | | | |
(In millions) | | | Percentage of Revenue (1) | | Increase (Decrease) |
Year ended December 31, | 2017 | | 2016 | | 2015 | | 2017 | | 2016 | | 2015 | | 2017 vs. 2016 | | 2016 vs. 2015 |
Revenue: | | | | | | | | | | | | | | | | | | | |
Processing and services | $ | 4,833 |
| | $ | 4,625 |
| | $ | 4,411 |
| | 84.8 | % | | 84.0 | % | | 84.0 | % | | $ | 208 |
| | 4 | % | | $ | 214 |
| | 5 | % |
Product | 863 |
| | 880 |
| | 843 |
| | 15.2 | % | | 16.0 | % | | 16.0 | % | | (17 | ) | | (2 | )% | | 37 |
| | 4 | % |
Total revenue | 5,696 |
| | 5,505 |
| | 5,254 |
| | 100.0 | % | | 100.0 | % | | 100.0 | % | | 191 |
| | 3 | % | | 251 |
| | 5 | % |
Expenses: | | | | | | | | | | | | | | | | | | | |
Cost of processing and services | 2,291 |
| | 2,212 |
| | 2,178 |
| | 47.4 | % | | 47.8 | % | | 49.4 | % | | 79 |
| | 4 | % | | 34 |
| | 2 | % |
Cost of product | 733 |
| | 747 |
| | 731 |
| | 84.9 | % | | 84.9 | % | | 86.7 | % | | (14 | ) | | (2 | )% | | 16 |
| | 2 | % |
Sub-total | 3,024 |
| | 2,959 |
| | 2,909 |
| | 53.1 | % | | 53.8 | % | | 55.4 | % | | 65 |
| | 2 | % | | 50 |
| | 2 | % |
Selling, general and administrative | 1,150 |
| | 1,101 |
| | 1,034 |
| | 20.2 | % | | 20.0 | % | | 19.7 | % | | 49 |
| | 4 | % | | 67 |
| | 6 | % |
Gain on sale of business | (10 | ) | | — |
| | — |
| | (0.2 | )% | | — |
| | — |
| | 10 |
| | — |
| | — |
| | — |
|
Total expenses | 4,164 |
| | 4,060 |
| | 3,943 |
| | 73.1 | % | | 73.8 | % | | 75.1 | % | | 104 |
| | 3 | % | | 117 |
| | 3 | % |
Operating income | 1,532 |
| | 1,445 |
| | 1,311 |
| | 26.9 | % | | 26.2 | % | | 24.9 | % | | 87 |
| | 6 | % | | 134 |
| | 10 | % |
Interest expense | (176 | ) | | (163 | ) | | (170 | ) | | (3.1 | )% | | (3.0 | )% | | (3.2 | )% | | 13 |
| | 8 | % | | (7 | ) | | (4 | )% |
Interest and investment income (loss), net | 2 |
| | (7 | ) | | 1 |
| | — |
| | (0.1 | )% | | — |
| | 9 |
| | 129 | % | | (8 | ) | | (800 | )% |
Loss on early debt extinguishment | — |
| | — |
| | (85 | ) | | — |
| | — |
| | (1.6 | )% | | — |
| | — |
| | (85 | ) | | (100 | )% |
Income from continuing operations before income taxes and income from investment in unconsolidated affiliate | $ | 1,358 |
| | $ | 1,275 |
| | $ | 1,057 |
| | 23.8 | % | | 23.2 | % | | 20.1 | % | | $ | 83 |
| | 7 | % | | $ | 218 |
| | 21 | % |
| |
(1) | Percentage of revenue is calculated as the relevant revenue, expense, income or loss amount divided by total revenue, except for cost of processing and services and cost of product amounts which are divided by the related component of revenue. |
|
| | | | | | | | | | | | | | | | | | |
(In millions)
Year ended December 31, | Payments | | Financial | | Corporate and Other | | Total |
Total revenue: | | | | | | | | | | |
2017 | $ | 3,234 |
| | | $ | 2,530 |
| | | $ | (68 | ) | | $ | 5,696 |
| |
2016 | 3,090 |
| | | 2,477 |
| | | (62 | ) | | 5,505 |
| |
2015 | 2,862 |
| | | 2,443 |
| | | (51 | ) | | 5,254 |
| |
| | | | | | | | | | |
Revenue growth: | | | | | | | | | | |
2017 | $ | 144 |
| | | $ | 53 |
| | | $ | (6 | ) | | $ | 191 |
| |
2017 percentage | 5 | % | | | 2 | % | | | | | 3 | % | |
2016 | $ | 228 |
| | | $ | 34 |
| | | $ | (11 | ) | | $ | 251 |
| |
2016 percentage | 8 | % | | | 1 | % | | | | | 5 | % | |
| | | | | | | | | | |
Operating income: | | | | | | | | | | |
2017 | $ | 1,034 |
| | | $ | 849 |
| | | $ | (351 | ) | | $ | 1,532 |
| |
2016 | 943 |
| | | 823 |
| | | (321 | ) | | 1,445 |
| |
2015 | 840 |
| | | 826 |
| | | (355 | ) | | 1,311 |
| |
| | | | | | | | | | |
Operating income growth: | | | | | | | | | | |
2017 | $ | 91 |
| | | $ | 26 |
| | | $ | (30 | ) | | $ | 87 |
| |
2017 percentage | 10 | % | | | 3 | % | | | | | 6 | % | |
2016 | $ | 103 |
| | | $ | (3 | ) | | | $ | 34 |
| | $ | 134 |
| |
2016 percentage | 12 | % | | | — | % | | | | | 10 | % | |
| | | | | | | | | | |
Operating margin: | | | | | | | | | | |
2017 | 32.0 | % | | | 33.5 | % | | | | | 26.9 | % | |
2016 | 30.5 | % | | | 33.2 | % | | | | | 26.2 | % | |
2015 | 29.3 | % | | | 33.8 | % | | | | | 24.9 | % | |
| | | | | | | | | | |
Operating margin growth: (1) | | | | | | | | | | |
2017 | 150 |
| bps | | 30 |
| bps | | | | 70 |
| bps |
2016 | 120 |
| bps | | (60 | ) | bps | | | | 130 |
| bps |
| |
(1) | Represents the basis point growth or decline in operating margin. |
Total Revenue
Total revenue increased $191 million, or 3%, in 2017 and increased $251 million, or 5%, in 2016 compared to the prior years. The increase in total revenue during 2017 and 2016 was attributable to revenue growth in our Payments segment of 5% and 8%, respectively, and revenue growth in our Financial segment of 2% and 1%, respectively, compared to the prior years.
Revenue in our Payments segment increased $144 million, or 5%, in 2017 and increased $228 million, or 8%, in 2016 compared to the prior years. Revenue growth at our card services business contributed approximately 2.5% in each of 2017 and 2016 to the Payments segment revenue growth largely due to increased transaction volumes. Increased volumes also drove revenue growth contributions of 1% in 2017 from our electronic payments business and 2% in 2016 from our output solutions business, which included a higher level of EMV chip card manufacturing and personalization, compared to the prior years. Revenue from in-year business acquisitions further contributed $22 million, or 1%, and $86 million, or 3%, in 2017 and 2016, respectively, to Payments segment revenue growth.
Revenue in our Financial segment increased $53 million, or 2%, in 2017 and increased $34 million, or 1%, in 2016 compared to the prior years. Our lending solutions business contributed approximately 2% and 1% to the Financial segment revenue growth in 2017 and 2016, respectively, driven by increased volumes. In addition, our account processing business contributed approximately 1% to the Financial segment revenue growth in 2016. Financial segment revenue growth was partially offset by the Australian item processing business disposition in 2017 and lower revenue in our international business in 2016, which each negatively impacted Financial segment revenue growth by approximately 1% compared to the prior years.
Total Expenses
Total expenses increased $104 million in 2017 and $117 million in 2016, or 3% in each year, compared to the prior years. Total expenses as a percentage of total revenue was 73.1%, 73.8% and 75.1% in 2017, 2016 and 2015, respectively. Total expenses were favorably impacted by 20 basis points in 2017 compared to 2016 due to the gain on the sale of our Australian item processing business.
Cost of processing and services as a percentage of processing and services revenue was 47.4%, 47.8% and 49.4% in 2017, 2016 and 2015, respectively. Cost of processing and services as a percentage of processing and services revenue was favorably impacted in both 2017 and 2016 by increased operating leverage in our recurring revenue businesses. Cost of processing and services as a percentage of processing and services revenue in 2016 was also favorably impacted by approximately 80 basis points from lower amortization related to certain fully amortized acquisition-related intangible assets compared to the prior year.
Cost of product as a percentage of product revenue was consistent in 2017 and 2016 at 84.9%, and decreased from 86.7% in 2015. Cost of product as a percentage of product revenue was negatively impacted in 2015 by increased expenses in our output solutions business associated with additional investments to expand our card manufacturing and personalization capacity.
Selling, general and administrative expenses as a percentage of total revenue was 20.2%, 20.0% and 19.7% in 2017, 2016 and 2015, respectively. The increase in selling, general and administrative expenses as a percentage of total revenue in 2017 and 2016 was primarily due to increased costs associated with acquisitions.
Operating Income and Operating Margin
Total operating income increased $87 million, or 6%, in 2017 and increased $134 million, or 10%, in 2016 compared to the prior years. Total operating margin increased to 26.9% in 2017 from 26.2% in 2016 and 24.9% in 2015.
Operating income in our Payments segment increased $91 million, or 10%, in 2017 and increased $103 million, or 12%, in 2016 compared to the prior years. Operating margin was 32.0%, 30.5% and 29.3% in 2017, 2016 and 2015, respectively, increasing 150 basis points in 2017 and 120 basis points in 2016. Our card services business contributed approximately 110 basis points in each of 2017 and 2016 to the Payments segment operating margin growth largely attributable to scalable revenue growth. In addition, Payments segment operating margin was positively impacted by approximately 90 basis points from our electronic payments business in 2017 and by approximately 70 basis points from our output solutions business in 2016, attributable to improved operating leverage and product mix, respectively. Payments segment operating margin improvement was partially offset by approximately 50 basis points in each of 2017 and 2016 as a result of in-year acquisitions.
Operating income in our Financial segment increased $26 million, or 3%, in 2017 and was generally consistent in 2016 compared to the prior years. Operating margin was 33.5%, 33.2% and 33.8% in 2017, 2016 and 2015, respectively, increasing 30 basis points in 2017 and decreasing 60 basis points in 2016. Financial segment operating margin in 2017 was positively impacted by approximately 70 basis points from scalable revenue growth. Increased expenses associated with incremental investments in innovation-based solutions negatively impacted Financial operating margin by 30 basis points and 60 basis points in 2017 and 2016, respectively.
The operating loss in Corporate and Other increased $30 million in 2017 and decreased $34 million in 2016 compared to the prior years. The operating loss increase in 2017 was primarily attributable to increased acquisition and related integration costs of $12 million and increased employee benefit expenses, including severance, of $20 million. These increased costs were partially offset by a $10 million gain on the sale of our Australian item processing business. The operating loss improvement in 2016 was primarily due to lower amortization related to certain fully amortized acquisition-related intangible assets compared to 2015.
Interest Expense
Interest expense increased $13 million, or 8%, in 2017 and decreased $7 million, or 4%, in 2016 compared to the prior years. Higher average variable interest rates and higher average outstanding debt contributed approximately $7 million and $6 million, respectively, to increased interest expense in 2017 compared to 2016. The lower interest expense in 2016 was primarily due to the reclassification of $7 million to interest expense for unamortized losses on settled cash flow hedges related to the early extinguishment of debt in 2015.
Interest and Investment Income (Loss), net
The net interest and investment loss in 2016 was attributable to a non-cash write-off of a $7 million cost-method investment.
Loss on Early Debt Extinguishment
In May 2015, we redeemed our $600 million aggregate principal amount of 3.125% senior notes due in 2016 and $500 million aggregate principal amount of 6.8% senior notes due in 2017, which resulted in a pre-tax loss on early debt extinguishment of $85 million related to make-whole payments and other costs associated with redemption.
Income Tax Provision
Income tax provision as a percentage of income from continuing operations before income from investment in unconsolidated affiliate was 11.6%, 38.6% and 35.7% in 2017, 2016 and 2015, respectively. The rate in 2017 decreased by 20.3% attributable to the enactment of the Tax Cuts and Jobs Act, as further described below, and by 3.6% attributable to excess tax benefits from share-based compensation awards recognized as a reduction in the income tax provision as a result of the 2017 adoption of Accounting Standards Update 2016-09, Compensation - Stock Compensation (Topic 718): Improvements to Employee Share-Based Payment Accounting. The higher rate in 2016 compared to 2015 was primarily due to the level of income tax expense associated with our share of the net gains on sales transactions by our unconsolidated affiliate, StoneRiver.
On December 22, 2017, the U.S. government enacted comprehensive tax legislation commonly referred to as the Tax Cuts and Jobs Act. The Tax Act makes broad changes to the U.S. tax code, including, but not limited to, (1) reducing the U.S. federal corporate tax rate from 35 percent to 21 percent beginning in 2018; (2) requiring companies to pay a one-time transition tax on certain un-repatriated earnings of foreign subsidiaries; (3) generally eliminating U.S. federal income taxes on dividends from foreign subsidiaries; (4) requiring U.S. federal taxable income to include certain earnings of controlled foreign corporations; and (5) creating a new limitation on deductible interest expense. The provisions of the Tax Act decreased our 2017 effective tax rate by 20.3%, primarily due to the re-evaluation of the net deferred tax liability to reflect the lower federal tax rate of 21 percent. The ultimate impact of the Tax Act may differ from the reported amounts due to changes in interpretations and assumptions, as well as guidance that may be issued in the future.
Income from Investment in Unconsolidated Affiliate
During 2017 and 2015, StoneRiver recognized net gains on the sales of subsidiary businesses, and in 2016, recognized a net gain on the sale of a business interest, resulting in our share of StoneRiver income of $32 million, $147 million and $32 million in 2017, 2016 and 2015, respectively.
Income from Discontinued Operations
Income from discontinued operations in 2017 included a litigation settlement related to a prior disposition of $19 million, net of income tax of $7 million, and earnings related to an acquired business held for sale.
Net Income Per Share - Diluted from Continuing Operations
Net income per share-diluted from continuing operations was $5.71, $4.15 and $2.99 in 2017, 2016 and 2015, respectively. Net income per share-diluted from continuing operations was favorably impacted by discrete income tax benefits associated with the Tax Act of $1.28 per share in 2017 and from our share of net investment gains, primarily from StoneRiver capital transactions, of $0.09, $0.39 and $0.07 per share in 2017, 2016 and 2015, respectively. Net income per share-diluted from continuing operations was negatively impacted in 2017 and 2016 by merger and integration costs of $0.23 and $0.17 per share, respectively, and in 2015 by debt extinguishment and refinancing costs of $0.25 per share. The amortization of acquisition-related intangible assets also reduced net income per share-diluted from continuing operations by $0.49, $0.46 and $0.53 per share in 2017, 2016 and 2015, respectively.
Liquidity and Capital Resources
General
Our primary liquidity needs are: (i) to fund normal operating expenses; (ii) to meet the interest and principal requirements of our outstanding indebtedness; and (iii) to fund capital expenditures and operating lease payments. We believe these needs will be satisfied using cash flow generated by our operations, along with our cash and cash equivalents of $325 million and available borrowings under our revolving credit facility of $0.9 billion at December 31, 2017. The following table summarizes our operating cash flow and capital expenditure amounts for the years ended December 31, 2017 and 2016, respectively.
|
| | | | | | | | | | | | | | |
| Year Ended December 31, | | Increase (Decrease) |
(In millions) | 2017 | | 2016 | | $ | | % |
Income from continuing operations | $ | 1,232 |
| | $ | 930 |
| | $ | 302 |
| | |
Depreciation and amortization | 433 |
| | 411 |
| | 22 |
| | |
Share-based compensation | 63 |
| | 68 |
| | (5 | ) | | |
Excess tax benefits from share-based awards | — |
| | (51 | ) | | 51 |
| | |
Deferred income taxes | (247 | ) | | 21 |
| | (268 | ) | | |
Income from investment in unconsolidated affiliate | (32 | ) | | (147 | ) | | 115 |
| | |
Dividends from unconsolidated affiliate | 45 |
| | 151 |
| | (106 | ) | | |
Non-cash impairment charges | 18 |
| | 17 |
| | 1 |
| | |
Gain on sale of business | (10 | ) | | — |
| | (10 | ) | | |
Net changes in working capital and other | (19 | ) | | 31 |
| | (50 | ) | | |
Operating cash flow | $ | 1,483 |
| | $ | 1,431 |
| | $ | 52 |
| | 4 | % |
Capital expenditures | $ | 287 |
| | $ | 290 |
| | $ | (3 | ) | | (1 | )% |
Our net cash provided by operating activities, or operating cash flow, was $1.48 billion in 2017, an increase of 4% compared to $1.43 billion in 2016. This increase was primarily due to improved operating results, partially offset by $106 million of lower cash dividends received from our StoneRiver joint venture and unfavorable timing of payables. In 2017 and 2016, we received cash dividends of $45 million and $151 million, respectively, from our StoneRiver joint venture. These dividends, in their entirety, represented returns on our investment and are reported in cash flows from operating activities.
Our current policy is to use our operating cash flow primarily to fund capital expenditures, share repurchases and acquisitions, and to repay debt rather than to pay dividends. Our capital expenditures were approximately 5% of our total revenue in both 2017 and 2016.
Share Repurchases
We purchased $1.17 billion and $1.20 billion of our common stock in 2017 and 2016, respectively. On November 16, 2016, our board of directors authorized the purchase of up to 15.0 million shares of our common stock. As of December 31, 2017, we had approximately 10.7 million shares remaining under this authorization. Shares repurchased are generally held for issuance in connection with our equity plans.
Acquisitions and Dispositions
We completed four acquisitions in 2017 for an aggregate purchase price of $384 million, net of $33 million of acquired cash, and two acquisitions in 2016 for an aggregate purchase price of $265 million. We funded these acquisitions by utilizing a combination of available cash and existing availability under our revolving credit facility.
In January 2018, we completed the sale of the retail voucher business acquired in our 2017 acquisition of Monitise for proceeds of £37 million ($50 million). In addition, in February 2018, we announced a definitive agreement to sell a 55% interest of our lending solutions business, retaining a 45% interest in the joint venture.
Indebtedness
|
| | | | | | | |
| December 31, |
(In millions) | 2017 | | 2016 |
Revolving credit facility | $ | 1,068 |
| | $ | 647 |
|
Term loan | 540 |
| | 629 |
|
2.7% senior notes due 2020 | 846 |
| | 845 |
|
4.625% senior notes due 2020 | 449 |
| | 448 |
|
4.75% senior notes due 2021 | 398 |
| | 398 |
|
3.5% senior notes due 2022 | 696 |
| | 695 |
|
3.85% senior notes due 2025 | 894 |
| | 893 |
|
Other borrowings | 9 |
| | 7 |
|
Total debt (including current maturities) | $ | 4,900 |
| | $ | 4,562 |
|
At December 31, 2017, our debt consisted primarily of $3.3 billion of senior notes, $1.1 billion of revolving credit facility borrowings and $540 million of term loan borrowings. Interest on our senior notes is paid semi-annually. We were in compliance with all financial debt covenants during 2017. Additional information about our debt structure and associated instruments is included in Note 5 to the consolidated financial statements.
Variable Rate Debt
We maintain a $2.0 billion revolving credit agreement and a term loan with a syndicate of banks. Both the outstanding borrowings under the revolving credit facility and the term loan bear interest at a variable rate based on LIBOR or on a base rate, plus a specified margin based on our long-term debt rating in effect from time to time. The variable interest rate was 2.59% on the revolving credit facility borrowings and 2.82% on the term loan borrowings at December 31, 2017. There are no significant commitment fees and no compensating balance requirements on the revolving credit facility, which matures in April 2020. The outstanding principal balance on the term loan of $540 million is due at maturity in October 2018. At December 31, 2017, the term loan was classified in the consolidated balance sheet as long-term as we have the intent to refinance this debt on a long-term basis and the ability to do so under our revolving credit facility. The revolving credit facility and the term loan contain various, substantially similar restrictions and covenants that require us, among other things, to: (i) limit our consolidated indebtedness as of the end of each fiscal quarter to no more than three and one-half times consolidated net earnings before interest, taxes, depreciation and amortization and certain other adjustments during the period of four fiscal quarters then ended, and (ii) maintain consolidated net earnings before interest, taxes, depreciation and amortization and certain other adjustments of at least three times consolidated interest expense as of the end of each fiscal quarter for the period of four fiscal quarters then ended.
Other
Access to capital markets impacts our cost of capital, our ability to refinance maturing debt and our ability to fund future acquisitions. Our ability to access capital on favorable terms depends on a number of factors, including general market conditions, interest rates, credit ratings on our debt securities, perception of our potential future earnings and the market price of our common stock. As of December 31, 2017, we had a corporate credit rating of Baa2 with a stable outlook from Moody’s Investors Service, Inc. (“Moody’s”) and BBB with a stable outlook from Standard & Poor’s Ratings Services (“S&P”) on our senior unsecured debt securities.
The interest rates payable on our senior notes, revolving credit facility and term loan are subject to adjustment from time to time if Moody’s or S&P changes the debt rating applicable to the notes. If the ratings from Moody’s or S&P decrease below investment grade, the per annum interest rates are subject to increase by up to two percent. In no event will the total increase in the per annum interest rates exceed two percent above the original interest rates, nor will the per annum interest rate be reduced below the original interest rate applicable to the senior notes.
Off-Balance Sheet Arrangements and Contractual Obligations
We do not participate in, nor have we created, any off-balance sheet variable interest entities or other off-balance sheet financing. The following table details our contractual obligations at December 31, 2017:
|
| | | | | | | | | | | | | | | | | | | | |
(In millions) | | Total | | Less than 1 year | | 1-3 years | | 3-5 years | | More than 5 years |
Long-term debt including interest (1) (2) | | $ | 5,550 |
| | $ | 168 |
| | $ | 3,187 |
| | $ | 1,217 |
| | $ | 978 |
|
Minimum operating lease payments (1) | | 410 |
| | 109 |
| | 133 |
| | 67 |
| | 101 |
|
Purchase obligations (1) | | 276 |
| | 167 |
| | 107 |
| | 2 |
| | — |
|
Income tax obligations | | 42 |
| | 10 |
| | 17 |
| | 11 |
| | 4 |
|
Total | | $ | 6,278 |
| | $ | 454 |
| | $ | 3,444 |
| | $ | 1,297 |
| | $ | 1,083 |
|
| |
(1) | Interest, operating lease and purchase obligations are reported on a pre-tax basis. |
| |
(2) | The calculations assume that only mandatory debt repayments are made, the term loan is refinanced on a long-term basis under the revolving credit facility, no additional refinancing or lending occurs, and the variable rates on the revolving credit facility and term loan are priced at the rate in effect as of December 31, 2017. |
Item 7A. Quantitative and Qualitative Disclosures About Market Risk
Market risk refers to the risk that a change in the level of one or more market prices, interest rates, currency exchange rates, indices, correlations or other market factors, such as liquidity, will result in losses for a certain financial instrument or group of financial instruments. We are exposed primarily to interest rate risk and market price risk on outstanding debt, investments of subscriber funds and foreign currency. Our senior management actively monitors these risks.
We manage our debt structure and interest rate risk through the use of fixed- and floating-rate debt. Based on our outstanding debt with variable interest rates at December 31, 2017, a 1% increase in our borrowing rate would increase annual interest expense in 2018 by approximately $16 million.
In connection with processing electronic payments transactions, the funds we receive from subscribers are invested into short-term, highly liquid investments from the time we collect the funds until payments are made to the applicable recipients. Subscriber funds are not included in our consolidated balance sheets and can fluctuate significantly based on consumer bill payment and debit card activity. During 2017, the subscriber funds daily average balance approximated $1.2 billion. A 1% increase or decrease in applicable interest rates would not have a material impact on our annual income from continuing operations.
We conduct business in the United States and in foreign countries and are exposed to foreign currency risk from changes in the value of underlying assets and liabilities of our non-U.S. dollar denominated foreign investments and foreign currency transactions. We have entered into foreign currency forward exchange contracts with total notional values of approximately $150 million as of December 31, 2017 to hedge foreign currency exposure to the Indian Rupee. In 2017, approximately 5% of our total revenue was from clients in foreign countries. Risk can be estimated by measuring the impact of a near-term adverse movement of 10% in foreign currency rates against the U.S. dollar. If these rates were 10% higher or lower at December 31, 2017, there would not have been a material impact on our annual income from continuing operations or financial position.
Item 8. Financial Statements and Supplementary Data
Index to Consolidated Financial Statements
Fiserv, Inc.
Consolidated Statements of Income
|
| | | | | | | | | | | | |
In millions, except per share data Year ended December 31, | | 2017 | | 2016 | | 2015 |
| | | | | | |
Revenue: | | | | | | |
Processing and services | | $ | 4,833 |
| | $ | 4,625 |
| | $ | 4,411 |
|
Product | | 863 |
| | 880 |
| | 843 |
|
Total revenue | | 5,696 |
| | 5,505 |
| | 5,254 |
|
Expenses: | | | | | | |
Cost of processing and services | | 2,291 |
| | 2,212 |
| | 2,178 |
|
Cost of product | | 733 |
| | 747 |
| | 731 |
|
Selling, general and administrative | | 1,150 |
| | 1,101 |
| | 1,034 |
|
Gain on sale of business | | (10 | ) | | — |
| | — |
|
Total expenses | | 4,164 |
| | 4,060 |
| | 3,943 |
|
Operating income | | 1,532 |
| | 1,445 |
| | 1,311 |
|
Interest expense | | (176 | ) | | (163 | ) | | (170 | ) |
Interest and investment income (loss), net | | 2 |
| | (7 | ) | | 1 |
|
Loss on early debt extinguishment | | — |
| | — |
| | (85 | ) |
Income from continuing operations before income taxes and income from investment in unconsolidated affiliate | | 1,358 |
| | 1,275 |
| | 1,057 |
|
Income tax provision | | (158 | ) | | (492 | ) | | (377 | ) |
Income from investment in unconsolidated affiliate | | 32 |
| | 147 |
| | 32 |
|
Income from continuing operations | | 1,232 |
| | 930 |
| | 712 |
|
Income from discontinued operations, net of income taxes | | 14 |
| | — |
| | — |
|
Net income | | $ | 1,246 |
| | $ | 930 |
| | $ | 712 |
|
| | | | | | |
Net income per share - basic: | | | | | | |
Continuing operations | | $ | 5.84 |
| | $ | 4.22 |
| | $ | 3.04 |
|
Discontinued operations | | 0.07 |
| | — |
| | — |
|
Total | | $ | 5.90 |
| | $ | 4.22 |
| | $ | 3.04 |
|
Net income per share - diluted: | | | | | | |
Continuing operations | | $ | 5.71 |
| | $ | 4.15 |
| | $ | 2.99 |
|
Discontinued operations | | 0.07 |
| | — |
| | — |
|
Total | | $ | 5.78 |
| | $ | 4.15 |
| | $ | 2.99 |
|
| | | | | | |
Shares used in computing net income per share: | | | | | | |
Basic | | 211.1 |
| | 220.3 |
| | 233.9 |
|
Diluted | | 215.6 |
| | 223.9 |
| | 238.0 |
|
See accompanying notes to consolidated financial statements.
28
Fiserv, Inc.
Consolidated Statements of Comprehensive Income
|
| | | | | | | | | | | | |
In millions Year ended December 31, | | 2017 | | 2016 | | 2015 |
| | | | | | |
Net income | | $ | 1,246 |
| | $ | 930 |
| | $ | 712 |
|
Other comprehensive income (loss): | | | | | | |
Fair market value adjustment on cash flow hedges, net of income tax provision of $2 million | | 4 |
| | — |
| | — |
|
Reclassification adjustment for net realized losses on cash flow hedges included in interest expense, net of income tax provision of $4 million, $5 million and $6 million | | 6 |
| | 7 |
| | 10 |
|
Foreign currency translation | | 12 |
| | (9 | ) | | (21 | ) |
Total other comprehensive income (loss) | | 22 |
| | (2 | ) | | (11 | ) |
Comprehensive income | | $ | 1,268 |
| | $ | 928 |
| | $ | 701 |
|
See accompanying notes to consolidated financial statements.
29
Fiserv, Inc.
Consolidated Balance Sheets
|
| | | | | | | | |
In millions December 31, | | 2017 | | 2016 |
| | | | |
Assets | | | | |
Cash and cash equivalents | | $ | 325 |
| | $ | 300 |
|
Trade accounts receivable, less allowance for doubtful accounts | | 997 |
| | 902 |
|
Prepaid expenses and other current assets | | 603 |
| | 526 |
|
Assets held for sale | | 50 |
| | — |
|
Total current assets | | 1,975 |
| | 1,728 |
|
Property and equipment, net | | 390 |
| | 405 |
|
Intangible assets, net | | 1,882 |
| | 1,833 |
|
Goodwill | | 5,590 |
| | 5,373 |
|
Other long-term assets | | 452 |
| | 404 |
|
Total assets | | $ | 10,289 |
| | $ | 9,743 |
|
Liabilities and Shareholders’ Equity | | | | |
Accounts payable and accrued expenses | | $ | 1,383 |
| | $ | 1,242 |
|
Current maturities of long-term debt | | 3 |
| | 95 |
|
Deferred revenue | | 552 |
| | 483 |
|
Total current liabilities | | 1,938 |
| | 1,820 |
|
Long-term debt | | 4,897 |
| | 4,467 |
|
Deferred income taxes | | 552 |
|
| 762 |
|
Other long-term liabilities | | 171 |
| | 153 |
|
Total liabilities | | 7,558 |
| | 7,202 |
|
Commitments and Contingencies | |
| |
|
Shareholders’ Equity | | | | |
Preferred stock, no par value: 25.0 million shares authorized; none issued | | — |
| | — |
|
Common stock, $0.01 par value: 900.0 million shares authorized; 395.7 million shares issued | | 4 |
| | 4 |
|
Additional paid-in capital | | 1,035 |
| | 1,020 |
|
Accumulated other comprehensive loss | | (54 | ) | | (76 | ) |
Retained earnings | | 10,240 |
| | 8,994 |
|
Treasury stock, at cost, 188.1 million and 180.2 million shares | | (8,494 | ) | | (7,401 | ) |
Total shareholders’ equity | | 2,731 |
| | 2,541 |
|
Total liabilities and shareholders’ equity | | $ | 10,289 |
| | $ | 9,743 |
|
See accompanying notes to consolidated financial statements.
30
Fiserv, Inc.
Consolidated Statements of Shareholders’ Equity
|
| | | | | | | | | | | | | | | | | | | | | | | | | | |
| | Common Stock | | Additional Paid-In Capital | | Accumulated Other Comprehensive Loss | | Retained Earnings | | Treasury Stock |
In millions | | Shares | | Amount | | Shares | | Amount |
| | | | | | | | | | | | | | |
Balance at January 1, 2015 | | 396 |
| | $ | 4 |
| | $ | 897 |
| | $ | (63 | ) | | $ | 7,352 |
| | 155 |
| | $ | (4,895 | ) |
Net income | |
|
| |
|
| |
|
| |
|
| | 712 |
| |
|
| |
|
|
Other comprehensive loss | |
|
| |
|
| |
|
| | (11 | ) | |
|
| |
|
| |
|
|
Share-based compensation | |
|
| |
|
| | 65 |
| |
|
| |
|
| |
|
| |
|
|
Shares issued under stock plans including income tax benefits | |
|
| |
|
| | (10 | ) | |
|
| |
|
| | (2 | ) | | 80 |
|
Purchases of treasury stock | |
|
| |
|
| |
|
| |
|
| |
|
| | 17 |
| | (1,471 | ) |
Balance at December 31, 2015 | | 396 |
| | 4 |
| | 952 |
| | (74 | ) | | 8,064 |
| | 170 |
| | (6,286 | ) |
Net income | |
|
| |
|
| |
|
| |
|
| | 930 |
| |
|
| |
|
|
Other comprehensive loss | |
|
| |
|
| |
|
| | (2 | ) | |
|
| |
|
| |
|
|
Share-based compensation | |
|
| |
|
| | 68 |
| |
|
| |
|
| |
|
| |
|
|
Shares issued under stock plans including income tax benefits | |
|
| |
|
| | — |
| |
|
| |
|
| | (2 | ) | | 83 |
|
Purchases of treasury stock | |
|
| |
|
| |
|
| |
|
| |
|
| | 12 |
| | (1,198 | ) |
Balance at December 31, 2016 | | 396 |
| | 4 |
| | 1,020 |
| | (76 | ) | | 8,994 |
| | 180 |
| | (7,401 | ) |
Net income | |
|
| |
|
| |
|
| |
|
| | 1,246 |
| |
|
| |
|
|
Other comprehensive income | |
|
| |
|
| |
|
| | 22 |
| |
|
| |
|
| |
|
|
Share-based compensation | |
|
| |
|
| | 63 |
| |
|
| |
|
| |
|
| |
|
|
Shares issued under stock plans | |
|
| |
|
| | (48 | ) | |
|
| |
|
| | (2 | ) | | 78 |
|
Purchases of treasury stock | |
|
| |
|
| |
|
| |
|
| |
|
| | 10 |
| | (1,171 | ) |
Balance at December 31, 2017 | | 396 |
| | $ | 4 |
| | $ | 1,035 |
| | $ | (54 | ) | | $ | 10,240 |
| | 188 |
| | $ | (8,494 | ) |
See accompanying notes to consolidated financial statements.
31
Fiserv, Inc.
Consolidated Statements of Cash Flows
|
| | | | | | | | | | | | |
In millions Year ended December 31, | | 2017 | | 2016 | | 2015 |
| | | | | | |
Cash flows from operating activities: | | | | | | |
Net income | | $ | 1,246 |
| | $ | 930 |
| | $ | 712 |
|
Adjustment for discontinued operations | | (14 | ) | | — |
| | — |
|
Adjustments to reconcile net income to net cash provided by operating activities from continuing operations: | | | | | | |
Depreciation and other amortization | | 274 |
| | 253 |
| | 223 |
|
Amortization of acquisition-related intangible assets | | 159 |
| | 158 |
| | 194 |
|
Share-based compensation | | 63 |
| | 68 |
| | 65 |
|
Excess tax benefits from share-based awards | | — |
| | (51 | ) | | (38 | ) |
Deferred income taxes | | (247 | ) | | 21 |
| | 20 |
|
Income from investment in unconsolidated affiliate | | (32 | ) | | (147 | ) | | (32 | ) |
Dividends from unconsolidated affiliate | | 45 |
| | 151 |
| | 36 |
|
Non-cash impairment charges | | 18 |
| | 17 |
| | 6 |
|
Gain on sale of business | | (10 | ) | | — |
| | — |
|
Loss on early debt extinguishment | | — |
| | — |
| | 85 |
|
Other operating activities | | (4 | ) | | (2 | ) | | (1 | ) |
Changes in assets and liabilities, net of effects from acquisitions: | | | | | | |
Trade accounts receivable | | (75 | ) | | (88 | ) | | (2 | ) |
Prepaid expenses and other assets | | (55 | ) | | (68 | ) | | (66 | ) |
Accounts payable and other liabilities | | 54 |
| | 178 |
| | 148 |
|
Deferred revenue | | 61 |
| | 11 |
| | (4 | ) |
Net cash provided by operating activities from continuing operations | | 1,483 |
| | 1,431 |
| | 1,346 |
|
Cash flows from investing activities: | | | | | | |
Capital expenditures, including capitalization of software costs | | (287 | ) | | (290 | ) | | (359 | ) |
Payments for acquisitions of businesses, net of cash acquired | | (384 | ) | | (265 | ) | | — |
|
Proceeds from sale of business | | 17 |
| | — |
| | — |
|
Purchases of investments | | (10 | ) | | (1 | ) | | (4 | ) |
Other investing activities | | 7 |
| | 2 |
| | 3 |
|
Net cash used in investing activities from continuing operations | | (657 | ) | | (554 | ) | | (360 | ) |
Cash flows from financing activities: | | | | | | |
Debt proceeds | | 2,310 |
| | 2,126 |
| | 3,121 |
|
Debt repayments, including redemption and other costs | | (1,985 | ) | | (1,863 | ) | | (2,707 | ) |
Proceeds from issuance of treasury stock | | 78 |
| | 79 |
| | 71 |
|
Purchases of treasury stock, including employee shares withheld for tax obligations | | (1,223 | ) | | (1,245 | ) | | (1,522 | ) |
Excess tax benefits from share-based awards | | — |
| | 51 |
| | 38 |
|
Other financing activities | | — |
| | — |
| | (6 | ) |
Net cash used in financing activities from continuing operations | | (820 | ) | | (852 | ) | | (1,005 | ) |
Net change in cash and cash equivalents from continuing operations | | 6 |
| | 25 |
| | (19 | ) |
Net cash flows from discontinued operations provided by operating activities | | 19 |
| | — |
| | — |
|
Cash and cash equivalents, beginning balance | | 300 |
| | 275 |
| | 294 |
|
Cash and cash equivalents, ending balance | | $ | 325 |
| | $ | 300 |
| | $ | 275 |
|
See accompanying notes to consolidated financial statements.
32
Fiserv, Inc.
Notes to Consolidated Financial Statements
1. Summary of Significant Accounting Policies
Description of the Business
Fiserv, Inc. and its subsidiaries (collectively, the “Company”) provide financial services technology to clients worldwide, including banks, savings banks, credit unions, investment management firms, leasing and finance companies, billers, retailers, merchants, and building societies. The Company provides account processing systems, electronic payments processing products and services, internet and mobile banking systems, and related services. The Company is principally located in the United States where it operates data and transaction processing centers, provides technology support, develops software and payment solutions, and offers consulting services.
The Company’s operations are comprised of the Payments and Industry Products (“Payments”) segment and the Financial Institution Services (“Financial”) segment. Additional information regarding the Company’s business segments is included in Note 9.
Principles of Consolidation
The consolidated financial statements include the accounts of Fiserv, Inc. and all 100% owned subsidiaries. Investments in less than 50% owned affiliates in which the Company has significant influence but not control are accounted for using the equity method of accounting. All intercompany transactions and balances have been eliminated in consolidation.
Use of Estimates
The preparation of financial statements in conformity with accounting principles generally accepted in the United States requires management to make estimates and assumptions that affect the reported amounts of assets and liabilities and disclosure of contingent assets and liabilities at the date of the financial statements and the reported amounts of revenue and expenses during the reporting period. Actual results could differ materially from those estimates.
Recent Accounting Pronouncements
Recently Adopted Accounting Pronouncements
In May 2017, the Financial Accounting Standards Board (“FASB”) issued Accounting Standards Update (“ASU”) No. 2017-09, Compensation - Stock Compensation (Topic 718): Scope of Modification Accounting (“ASU 2017-09”), which provides guidance on the types of changes to the terms or conditions of share-based payment awards to which an entity would be required to apply modification accounting. Under ASU 2017-09, an entity would not apply modification accounting if the fair value, vesting conditions, and classification of the award are the same immediately before and after the award is modified. ASU 2017-09 is effective for fiscal years, including interim periods within those fiscal years, beginning after December 15, 2017, with early adoption permitted in any interim period. Entities must apply the standard prospectively. The Company early adopted ASU 2017-09 effective September 30, 2017 and will apply the guidance prospectively to awards modified on or after the adoption date. The adoption of this ASU did not have any impact on the Company’s consolidated financial statements and is not expected to have a material impact on its consolidated financial statements going forward.
In January 2017, the FASB issued ASU No. 2017-04, Intangibles - Goodwill and Other (Topic 350): Simplifying the Test for Goodwill Impairment (“ASU 2017-04”), which eliminates Step 2 of the goodwill impairment test that had required a hypothetical purchase price allocation. Rather, entities should apply the same impairment assessment to all reporting units and recognize an impairment loss for the amount by which a reporting unit’s carrying amount exceeds its fair value, without exceeding the total amount of goodwill allocated to that reporting unit. Entities will continue to have the option to perform a qualitative assessment for a reporting unit to determine if the quantitative impairment test is necessary. ASU 2017-04 will be effective prospectively for annual or interim goodwill impairment tests in fiscal years beginning after December 15, 2019, or those beginning after January 1, 2017 if early adopted. The Company early adopted ASU 2017-04 in the first quarter of 2017. The adoption of this ASU did not have any impact on the Company’s consolidated financial statements and is not expected to have a material impact on its consolidated financial statements going forward.
In January 2017, the FASB issued ASU No. 2017-01, Business Combinations (Topic 805): Clarifying the Definition of a Business (“ASU 2017-01”), which clarifies the definition of a business with the objective of adding guidance and providing a more robust framework to assist reporting organizations with evaluating whether transactions should be accounted for as acquisitions (or disposals) of assets or businesses. For public entities, ASU 2017-01 is effective prospectively for fiscal years,
including interim periods within those fiscal years, beginning after December 15, 2017, with early adoption permitted for transactions occurring before the issuance or effective date of the standard for which financial statements have not yet been issued. The Company early adopted ASU 2017-01 in the first quarter of 2017, and the adoption did not have a material impact on its consolidated financial statements.
In August 2016, the FASB issued ASU No. 2016-15, Statement of Cash Flows (Topic 230): Classification of Certain Cash Receipts and Cash Payments (“ASU 2016-15”), which adds or clarifies guidance on the presentation and classification of eight specific types of cash receipts and cash payments in the statement of cash flows, with the intent of reducing diversity in practice. For public entities, ASU 2016-15 is effective for fiscal years, including interim periods within those fiscal years, beginning after December 15, 2017, with early adoption permitted. Entities must apply the guidance retrospectively to all periods presented unless retrospective application is impracticable. The Company early adopted ASU 2016-15 in the first quarter of 2017, and the adoption did not have a material impact on its consolidated financial statements.
In March 2016, the FASB issued ASU No. 2016-09, Compensation - Stock Compensation (Topic 718): Improvements to Employee Share-Based Payment Accounting (“ASU 2016-09”), which simplifies several aspects of the accounting for share-based payment awards, including the accounting for income taxes and forfeitures, as well as classification in the statement of cash flows. The standard requires that all tax effects related to share-based payments be recorded as income tax expense or benefit in the income statement at settlement or expiration and, accordingly, excess tax benefits and tax deficiencies be presented as operating activities in the statement of cash flows. For public entities, ASU 2016-09 was effective for annual periods beginning after December 15, 2016, including interim periods within those annual periods. The recognition of all excess tax benefits and tax deficiencies in the income statement, as well as related changes to the computation of diluted earnings per share, is to be applied prospectively. The impact of this standard on the Company’s consolidated financial statements depends on the intrinsic value of share-based compensation awards at the time of exercise or vesting, resulting in more variability in effective tax rates and net earnings, and also impacting the dilution of common stock equivalents. The Company adopted ASU 2016-09 effective January 1, 2017. As a result of this adoption, the Company recorded excess tax benefits related to share-based compensation awards of $48 million in 2017 in the income tax provision, whereas such benefits were previously recognized in equity. These benefits were partially offset by an increase in the dilution of common stock equivalents for calculating diluted earnings per share. The Company elected to apply the change in presentation in the statement of cash flows prospectively, and as a result, excess tax benefits are classified as operating activities when realized through reductions to subsequent tax payments. The treatment of forfeitures did not change as the Company elected to continue its current practice of estimating expected forfeitures.
Recently Issued Accounting Pronouncements
In August 2017, the FASB issued ASU No. 2017-12, Derivatives and Hedging (Topic 815): Targeted Improvements to Accounting for Hedging Activities (“ASU 2017-12”), which provides guidance designed to improve the financial reporting of hedging relationships to better portray the economic results of an entity’s risk management activities in its financial statements as well as to simplify the application of the hedge accounting guidance in current U.S. generally accepted accounting principles. For public entities, ASU 2017-12 is effective for fiscal years, including interim periods within those fiscal years, beginning after December 15, 2018, with early adoption permitted in any interim period or fiscal year. For cash flow and net investment hedges existing at the date of adoption, the standard requires a cumulative-effect adjustment related to eliminating the separate measurement of ineffectiveness to accumulated other comprehensive income with a corresponding adjustment to the opening balance of retained earnings as of the beginning of the fiscal year of adoption. The amended presentation and disclosure guidance is required only prospectively. The Company does not expect the adoption of ASU 2017-12 to have a material impact on its consolidated financial statements.
In October 2016, the FASB issued ASU No. 2016-16, Income Taxes (Topic 740): Intra-Entity Transfers of Assets Other Than Inventory (“ASU 2016-16”), which eliminates the current prohibition on immediate recognition of the current and deferred income tax effects of intra-entity transfers of assets other than inventory, with the intent of reducing complexity and diversity in practice. Under ASU 2016-16, entities must recognize the income tax consequences when the transfer occurs rather than deferring recognition. For public entities, ASU 2016-16 is effective for fiscal years, including interim periods within those fiscal years, beginning after December 15, 2017, with early adoption permitted as of the beginning of a fiscal year. Entities must apply the guidance on a modified retrospective basis through a cumulative-effect adjustment to retained earnings as of the beginning of the period of adoption. The Company does not expect the adoption of ASU 2016-16 to have a material impact on its consolidated financial statements.
In June 2016, the FASB issued ASU No. 2016-13, Financial Instruments - Credit Losses (Topic 326) (“ASU 2016-13”), which prescribes an impairment model for most financial assets based on expected losses rather than incurred losses. Under this model, an estimate of expected credit losses over the contractual life of the instrument is to be recorded as of the end of a reporting period as an allowance to offset the amortized cost basis, resulting in a net presentation of the amount expected to be
collected on the financial asset. For public entities, ASU 2016-13 is effective for fiscal years, including interim periods within those fiscal years, beginning after December 15, 2019. Early adoption is permitted for fiscal years beginning after December 15, 2018, including interim periods within those fiscal years. For most instruments, entities must apply the standard using a cumulative-effect adjustment to beginning retained earnings as of the beginning of the fiscal year of adoption. The Company is currently assessing the impact that the adoption of ASU 2016-13 will have on its consolidated financial statements.
In February 2016, the FASB issued ASU No. 2016-02, Leases (Topic 842) (“ASU 2016-02”), which requires lessees to recognize a lease liability and a right-of-use asset for each lease with a term longer than twelve months. The recognized liability is measured at the present value of lease payments not yet paid, and the corresponding asset represents the lessee’s right to use the underlying asset over the lease term and is based on the liability, subject to certain adjustments. For income statement purposes, the standard retains the dual model with leases classified as either operating or finance. Operating leases will result in straight-line expense while finance leases will result in a front-loaded expense pattern. For public entities, ASU 2016-02 is effective for annual and interim periods beginning after December 15, 2018, with early adoption permitted. The standard requires a modified retrospective transition approach for leases existing at, or entered into after, the beginning of the earliest comparative period presented in the financial statements. The Company is currently assessing the impact that the adoption of ASU 2016-02 will have on its consolidated financial statements.
In January 2016, the FASB issued ASU No. 2016-01, Recognition and Measurement of Financial Assets and Financial Liabilities (“ASU 2016-01”), which primarily affects the accounting for equity investments, financial liabilities under the fair value option, and the presentation and disclosure requirements of financial instruments. For public entities, ASU 2016-01 is effective for fiscal years, and interim periods within those years, beginning after December 15, 2017, with early adoption permitted for certain provisions of the standard. Entities must apply the standard, with certain exceptions, using a cumulative-effect adjustment to beginning retained earnings as of the beginning of the fiscal year of adoption. The Company does not expect the adoption of ASU 2016-01 to have a material impact on its consolidated financial statements.
In May 2014, the FASB issued ASU No. 2014-09, Revenue from Contracts with Customers (“ASU 2014-09”), to clarify the principles of recognizing revenue and to create common revenue recognition guidance between U.S. generally accepted accounting principles and International Financial Reporting Standards. ASU 2014-09 outlines a single comprehensive model for entities to use in accounting for revenue arising from contracts with customers and supersedes most current revenue recognition guidance, including industry-specific requirements. It also includes guidance on accounting for the incremental costs of obtaining and costs incurred to fulfill a contract with a customer. The core principle of the revenue model is that an entity recognizes revenue to depict the transfer of promised goods or services to customers in an amount that reflects the consideration to which the entity expects to be entitled in exchange for those goods or services. This model involves a five-step process for achieving that core principle, along with comprehensive disclosures about the nature, amount, timing and uncertainty of revenue and cash flows arising from contracts with customers. In August 2015, the FASB issued ASU 2015-14, Revenue from Contracts with Customers (Topic 606): Deferral of the Effective Date, to defer the effective date of the new revenue standard for one year and permit early adoption as of the original effective date in ASU 2014-09. For public entities, the new revenue standard is effective for annual and interim periods beginning after December 15, 2017. Entities have the option of adopting this new guidance using either a full retrospective or a modified approach with the cumulative effect of applying the guidance recognized at the date of initial application.
The Company adopted the new standard effective January 1, 2018 using the modified retrospective transition approach applied to all contracts, which results in a cumulative effect adjustment to retained earnings as of the date of adoption. Under this method, the Company will not restate the prior consolidated financial statements presented. However, the Company will be required to provide additional disclosures in 2018 related to the amount by which each relevant 2018 financial statement line item is affected by adoption of the new standard, and an explanation of the reasons for significant changes.
The Company has assessed the impacts of adopting this new revenue standard on its consolidated financial statements, related disclosures, accounting policies, and necessary control, process and systems changes, and expects the new revenue standard will not have an overall material impact on the amount and timing of revenue recognition. The Company expects the accounting for stand-ready account- and transaction-based processing fees, the Company’s most significant revenue stream, to remain substantially unchanged. Smaller impacted areas include the timing of revenue recognition of certain termination fees over the modified contract term, which will generally result in an acceleration of revenue as compared to the Company’s current accounting practice of recognition upon client deconversion, and the deferral of professional services revenue from certain transaction processing platform enhancements that are currently recognized as performed.
The new standard requires the Company to change its accounting for costs to obtain a contract, such as the capitalization of commissions for sales personnel which are currently expensed as incurred, and also requires expanded qualitative and quantitative disclosures. The estimated cumulative impact of adopting the new revenue standard on January 1, 2018 is an
increase in the opening balance of retained earnings of approximately $210 million, primarily related to the deferral of incremental sales commissions incurred in obtaining contracts in prior periods.
Fair Value Measurements
The Company applies fair value accounting for all assets and liabilities that are recognized or disclosed at fair value in its consolidated financial statements on a recurring basis. Fair value represents the amount that would be received from selling an asset or paid to transfer a liability in an orderly transaction between market participants at the measurement date. When determining the fair value measurements for assets and liabilities, the Company considers the principal or most advantageous market and the market-based risk measurements or assumptions that market participants would use in pricing the asset or liability.
The fair values of cash equivalents, trade accounts receivable, settlement assets and obligations, accounts payable, and client deposits approximate their respective carrying values due to the short period of time to maturity. The estimated fair value of total debt is described in Note 5 and was based on quoted prices in active markets for the Company’s senior notes (level 1 of the fair value hierarchy) and discounted cash flows based on the Company’s current incremental borrowing rate for its term loan (level 3 of the fair value hierarchy). The fair value of the Company’s revolving credit facility borrowings approximates carrying value as the underlying interest rate is variable based on LIBOR. The estimated fair value of the contingent consideration liability of $15 million at December 31, 2017 (see Note 2) was based on the present value of a probability-weighted assessment approach derived from the likelihood of achieving the various earn-out criteria (level 3 of the fair value hierarchy) and is reported in other long-term liabilities in the consolidated balance sheet. This estimated fair value has not changed since the acquisition date.
Derivatives
Derivatives are recorded in the consolidated balance sheets as either an asset or liability measured at fair value. If the derivative is designated as a cash flow hedge, the effective portions of the changes in the fair value of the derivative are recorded as a component of accumulated other comprehensive loss and recognized in the consolidated statements of income when the hedged item affects earnings. If the derivative is designated as a fair value hedge, the changes in the fair value of the derivative are recognized in earnings. To the extent the fair value hedge is effective, there is an offsetting adjustment to the basis of the item being hedged. Ineffective portions of changes in the fair value of hedges are recognized in earnings. The Company’s policy is to enter into derivatives with creditworthy institutions and not to enter into such derivatives for speculative purposes.
Foreign Currency
Foreign currency denominated assets and liabilities, where the functional currency is the local currency, are translated into U.S. dollars at the exchange rates in effect at the balance sheet date. Revenue and expenses are translated at the average exchange rates during the period. Gains and losses from foreign currency translation are recorded as a separate component of accumulated other comprehensive loss.
Revenue Recognition
The Company generates revenue from the delivery of processing, service and product solutions. Revenue is recognized when written contracts are signed, delivery has occurred, the fees are fixed or determinable, and collectability is reasonably assured.
Processing and services revenue is recognized as services are provided and is primarily derived from contracts that generate account- and transaction-based fees for data processing, transaction processing, electronic billing and payment services, electronic funds transfer, and debit processing services. In addition, processing and services revenue is derived from the fulfillment of professional services, including consulting activities. Certain of the Company’s revenue is generated from multiple element arrangements involving various combinations of product and service deliverables. The deliverables within these arrangements are evaluated at contract inception to determine whether they represent separate units of accounting, and if so, contract consideration is allocated to each deliverable based on relative selling price. The relative selling price is determined using vendor specific objective evidence of fair value, third-party evidence or best estimate of selling price. Revenue is then recognized in accordance with the appropriate revenue recognition guidance applicable to the respective elements. Also included in processing and services revenue is software maintenance fee revenue for ongoing client support, which is recognized ratably over the term of the applicable support period, generally 12 months. Deferred revenue consists primarily of advance cash receipts for services and is recognized as revenue when the services are provided.
Product revenue is primarily derived from integrated print and card production sales, as well as software license sales which represented less than 4% of total revenue. For software license agreements that do not require significant customization or modification, the Company recognizes software license revenue upon delivery, assuming persuasive evidence of an
arrangement exists, the license fee is fixed or determinable, and collection is reasonably assured. Arrangements with customers that include significant customization, modification or production of software are accounted for under contract accounting, with revenue recognized using the percentage-of-completion method based upon efforts-expended, such as labor hours, to measure progress towards completion. Changes in estimates for revenues, costs and profits are recognized in the period in which they are determinable and were not material for any period presented.
The Company includes reimbursements from clients, such as postage and telecommunication costs, in processing and services revenue and product revenue, while the related costs are included in cost of processing and services and cost of product.
Selling, General and Administrative Expenses
Selling, general and administrative expenses primarily consist of: salaries, wages, commissions and related expenses paid to sales personnel, administrative employees and management; advertising and promotional costs; depreciation and amortization; and other selling and administrative expenses.
Cash and Cash Equivalents
Cash and cash equivalents consist of cash and investments with original maturities of 90 days or less.
Allowance for Doubtful Accounts
The Company analyzes the collectability of trade accounts receivable by considering historical bad debts, client creditworthiness, current economic trends, changes in client payment terms and collection trends when evaluating the adequacy of the allowance for doubtful accounts. Any change in the assumptions used in analyzing a specific account receivable may result in an additional allowance for doubtful accounts being recognized in the period in which the change occurs. The allowance for doubtful accounts was $15 million at both December 31, 2017 and 2016.
Prepaid Expenses
Prepaid expenses represent advance payments for goods and services to be consumed in the future, such as maintenance, postage and insurance, and totaled $136 million and $141 million at December 31, 2017 and 2016, respectively.
Settlement Assets and Obligations
Settlement assets of $385 million and $312 million were included in prepaid expenses and other current assets at December 31, 2017 and 2016, respectively, and settlement obligations of $379 million and $305 million were included in accounts payable and accrued expenses at December 31, 2017 and 2016, respectively. Settlement assets and obligations result from timing differences between collection and fulfillment of payment transactions primarily associated with the Company’s walk-in and expedited bill payment service businesses. Settlement assets represent cash received or amounts receivable from agents, payment networks or directly from consumers. Settlement obligations represent amounts payable to clients and payees.
Property and Equipment
Property and equipment are reported at cost. Depreciation of property and equipment is computed primarily using the straight-line method over the shorter of the estimated useful life of the asset or the leasehold period, if applicable. Property and equipment consisted of the following at December 31:
|
| | | | | | | | | |
(In millions) | Estimated Useful Lives | | 2017 | | 2016 |
Land | — | | $ | 13 |
| | $ | 19 |
|
Data processing equipment | 3 to 5 years | | 726 |
| | 697 |
|
Buildings and leasehold improvements | 5 to 40 years | | 255 |
| | 256 |
|
Furniture and equipment | 5 to 8 years | | 182 |
| | 179 |
|
| | | 1,176 |
| | 1,151 |
|
Less: accumulated depreciation | | | (786 | ) | | (746 | ) |
Total | | | $ | 390 |
| | $ | 405 |
|
Depreciation expense for all property and equipment totaled $92 million, $90 million and $80 million in 2017, 2016 and 2015, respectively.
Intangible Assets
Intangible assets consisted of the following at December 31:
|
| | | | | | | | | | | | |
(In millions) | | Gross Carrying Amount | | Accumulated Amortization | | Net Book Value |
2017 | |
Customer related intangible assets | | $ | 2,293 |
| | $ | 1,168 |
| | $ | 1,125 |
|
Acquired software and technology | | 579 |
| | 460 |
| | 119 |
|
Trade names | | 117 |
| | 64 |
| | 53 |
|
Capitalized software development costs | | 737 |
| | 282 |
| | 455 |
|
Purchased software | | 241 |
| | 111 |
| | 130 |
|
Total | | $ | 3,967 |
| | $ | 2,085 |
| | $ | 1,882 |
|
| | | | | | |
(In millions) | | Gross Carrying Amount | | Accumulated Amortization | | Net Book Value |
2016 | |
Customer related intangible assets | | $ | 2,200 |
| | $ | 1,043 |
| | $ | 1,157 |
|
Acquired software and technology | | 507 |
| | 432 |
| | 75 |
|
Trade names | | 117 |
| | 57 |
| | 60 |
|
Capitalized software development costs | | 641 |
| | 233 |
| | 408 |
|
Purchased software | | 230 |
| | 97 |
| | 133 |
|
Total | | $ | 3,695 |
| | $ | 1,862 |
| | $ | 1,833 |
|
Customer related intangible assets represent customer contracts and relationships obtained as part of acquired businesses and are amortized over their estimated useful lives, generally 10 to 20 years. Acquired software and technology represents software and technology intangible assets obtained as part of acquired businesses and are amortized over their estimated useful lives, generally four to eight years. Trade names are amortized over their estimated useful lives, generally 10 to 20 years. Amortization expense for acquired intangible assets, which include customer related intangible assets, acquired software and technology, and trade names, totaled $159 million, $158 million and $194 million in 2017, 2016 and 2015, respectively.
The Company continually develops, maintains and enhances its products and systems. Product development expenditures represented approximately 8% of the Company’s total revenue in each of 2017 and 2016 and 9% in 2015. Research and development costs incurred prior to the establishment of technological feasibility are expensed as incurred. Routine maintenance of software products, design costs and other development costs incurred prior to the establishment of a product’s technological feasibility are also expensed as incurred. Costs are capitalized commencing when the technological feasibility of the software has been established.
Capitalized software development costs represent the capitalization of certain costs incurred to develop new software or to enhance existing software which is marketed externally or utilized by the Company to process client transactions. Capitalized software development costs are amortized over their estimated useful lives, generally five years. Gross software development costs capitalized for new products and enhancements to existing products totaled $159 million, $143 million and $137 million in 2017, 2016 and 2015, respectively. Amortization of previously capitalized software development costs that have been placed into service was $123 million, $106 million and $92 million in 2017, 2016 and 2015, respectively.
Purchased software represents software licenses purchased from third parties and is amortized over their estimated useful lives, generally three to five years. Amortization of purchased software totaled $44 million, $40 million and $33 million in 2017, 2016 and 2015, respectively.
The Company estimates that annual amortization expense with respect to acquired intangible assets recorded at December 31, 2017 will be approximately $160 million in each of 2018 and 2019, $130 million in each of 2020 and 2021, and $120 million in 2022. Amortization expense with respect to capitalized and purchased software recorded at December 31, 2017 is estimated to approximate $170 million in 2018.
Goodwill
Goodwill represents the excess of the purchase price over the fair value of identifiable net assets acquired and liabilities assumed in a business combination. The Company evaluates goodwill for impairment on an annual basis, or more frequently if circumstances indicate possible impairment. Goodwill is tested for impairment at a reporting unit level, determined to be at an operating segment level or one level below. When reviewing goodwill for impairment, the Company considers the amount of excess fair value over the carrying value of each reporting unit, the period of time since a reporting unit’s last quantitative test, the extent a reorganization or disposition changes the composition of one or more of the reporting units, and other factors to determine whether or not to first perform a qualitative test. When performing a qualitative test, the Company assesses numerous factors to determine whether it is more likely than not that the fair value of its reporting units are less than their respective carrying values. Examples of qualitative factors that the Company assesses include its share price, its financial performance, market and competitive factors in its industry, and other events specific to its reporting units. If the Company concludes that it is more likely than not that the fair value of a reporting unit is less than its carrying value, the Company performs a quantitative impairment test by comparing reporting unit carrying values to estimated fair values. No impairment was identified in the Company’s annual impairment assessment in the fourth quarter of 2017 as the estimated fair values of the respective reporting units exceeded the carrying values. In addition, there is no accumulated impairment loss through December 31, 2017. The changes in goodwill during 2017 and 2016 were as follows:
|
| | | | | | | | | | | | |
(In millions) | | Payments | | Financial | | Total |
Goodwill - December 31, 2015 | | $ | 3,437 |
| | $ | 1,763 |
| | $ | 5,200 |
|
Acquired goodwill | | 173 |
| | — |
| | 173 |
|
Goodwill - December 31, 2016 | | 3,610 |
| | 1,763 |
| | 5,373 |
|
Acquired goodwill | | 146 |
| | 71 |
| | 217 |
|
Disposed goodwill | | — |
| | (3 | ) | | (3 | ) |
Foreign currency adjustments | | 1 |
| | 2 |
| | 3 |
|
Goodwill - December 31, 2017 | | $ | 3,757 |
| | $ | 1,833 |
| | $ | 5,590 |
|
Asset Impairment
The Company reviews property and equipment, intangible assets and its investment in unconsolidated affiliate for impairment whenever events or changes in circumstances indicate that the carrying amount of the asset may not be recoverable. The Company reviews capitalized software development costs for impairment at each balance sheet date. Recoverability of property and equipment, capitalized software development costs, and other intangible assets is assessed by comparing the carrying amount of the asset to either the undiscounted future cash flows expected to be generated by the asset or the net realizable value of the asset, depending on the type of asset. The Company’s investment in unconsolidated affiliate is assessed by comparing the carrying amount of the investment to its estimated fair value and is impaired if any decline in fair value is determined to be other than temporary. Measurement of any impairment loss is based on estimated fair value.
Accounts Payable and Accrued Expenses
Accounts payable and accrued expenses consisted of the following at December 31:
|
| | | | | | | | |
(In millions) | | 2017 | | 2016 |
Trade accounts payable | | $ | 80 |
| | $ | 110 |
|
Client deposits | | 481 |
| | 409 |
|
Settlement obligations | | 379 |
| | 305 |
|
Accrued compensation and benefits | | 198 |
| | 184 |
|
Other accrued expenses | | 245 |
| | 234 |
|
Total | | $ | 1,383 |
| | $ | 1,242 |
|
Income Taxes
Deferred tax assets and liabilities are recognized for the expected future tax consequences attributable to differences between financial statement carrying amounts of existing assets and liabilities and their respective tax basis and net operating loss and tax credit carry-forwards. Deferred tax assets and liabilities are measured using enacted tax rates expected to apply to taxable income in the years in which those temporary differences are expected to be recovered or settled. A valuation allowance is
recorded against deferred tax assets if it is more-likely-than-not that some portion or all of the deferred tax assets will not be realized.
Accumulated Other Comprehensive Loss
Changes in accumulated other comprehensive loss by component, net of income taxes, consisted of the following:
|
| | | | | | | | | | | | | | | | |
(In millions) | | Cash Flow Hedges | | Foreign Currency Translation | | Other | | Total |
Balance at December 31, 2016 | | $ | (24 | ) | | $ | (50 | ) | | $ | (2 | ) | | $ | (76 | ) |
Other comprehensive income before reclassifications | | 4 |
| | 12 |
| | — |
| | 16 |
|
Amounts reclassified from accumulated other comprehensive loss | | 6 |
| | — |
| | — |
| | 6 |
|
Net current-period other comprehensive income | | 10 |
| | 12 |
| | — |
| | 22 |
|
Balance at December 31, 2017 | | $ | (14 | ) | | $ | (38 | ) | | $ | (2 | ) | | $ | (54 | ) |
|
| | | | | | | | | | | | | | | | |
(In millions) | | Cash Flow Hedges | | Foreign Currency Translation | | Other | | Total |
Balance at December 31, 2015 | | $ | (31 | ) | | $ | (41 | ) | | $ | (2 | ) | | $ | (74 | ) |
Other comprehensive loss before reclassifications | | — |
| | (9 | ) | | — |
| | (9 | ) |
Amounts reclassified from accumulated other comprehensive loss | | 7 |
| | — |
| | — |
| | 7 |
|
Net current-period other comprehensive (loss) income | | 7 |
| | (9 | ) | | — |
| | (2 | ) |
Balance at December 31, 2016 | | $ | (24 | ) | | $ | (50 | ) | | $ | (2 | ) | | $ | (76 | ) |
Based on the amounts recorded in accumulated other comprehensive loss at December 31, 2017, the Company estimates that it will recognize approximately $6 million in interest expense during the next twelve months related to settled interest rate hedge contracts.
The Company has entered into foreign currency forward exchange contracts, which have been designated as cash flow hedges, to hedge foreign currency exposure to the Indian Rupee. As of December 31, 2017 and 2016, the notional amount of these derivatives was approximately $150 million and $86 million, respectively, and the fair value totaling approximately $8 million and $1 million, respectively, is reported in prepaid expenses and other current assets in the consolidated balance sheet.
Net Income Per Share
Net income per share in each period is calculated using actual, unrounded amounts. Basic net income per share is computed using the weighted-average number of common shares outstanding during the year. Diluted net income per share is computed using the weighted-average number of common shares and common stock equivalents outstanding during the year. Common stock equivalents consist of stock options and restricted stock units and are computed using the treasury stock method. In 2017, 2016 and 2015, the Company excluded 0.7 million, 0.8 million and 0.9 million weighted-average shares, respectively, from the calculations of common stock equivalents for anti-dilutive stock options.
The computation of shares used in calculating basic and diluted net income per share is as follows:
|
| | | | | | | | | |
(In millions) | | 2017 | | 2016 | | 2015 |
Weighted-average common shares outstanding used for the calculation of net income per share - basic | | 211.1 |
| | 220.3 |
| | 233.9 |
|
Common stock equivalents | | 4.5 |
| | 3.6 |
| | 4.1 |
|
Weighted-average common shares outstanding used for the calculation of net income per share - diluted | | 215.6 |
| | 223.9 |
| | 238.0 |
|
Supplemental Cash Flow Information
|
| | | | | | | | | | | | |
(In millions) | | 2017 | | 2016 | | 2015 |
Interest paid | | $ | 160 |
| | $ | 147 |
| | $ | 150 |
|
Income taxes paid | | 409 |
| | 408 |
| | 306 |
|
Treasury stock purchases settled after the balance sheet date | | 5 |
| | 10 |
| | 15 |
|
2. Acquisitions and Dispositions
Acquisitions
The Company completed four acquisitions in 2017 and two acquisitions in 2016. The results of operations for all acquired businesses have been included in the accompanying consolidated statements of income from the dates of acquisition. This includes revenue of $123 million and $86 million in 2017 and 2016, respectively, and impacts to operating income in each year of approximately $5 million excluding acquired intangible asset amortization. Pro forma information for the Company’s acquisitions is not provided because they did not have a material effect on the Company’s consolidated results of operations.
On January 17, 2017, the Company completed its acquisition of Online Banking Solutions, Inc. (“OBS”), a provider of cash management and digital business banking solutions that complement and enrich the Company’s existing solutions. On July 31, 2017, the Company acquired the assets of PCLender, LLC (“PCLender”), a leader in internet-based mortgage software and mortgage lending technology solutions. The OBS and PCLender acquisitions are included in the Financial segment as their products are integrated across a number of the Company’s account processing solutions and will enable the Company’s bank and credit union clients to better serve their commercial and mortgage customers. On August 18, 2017, the Company acquired Dovetail Group Limited (“Dovetail”), a leading provider of bank payments and liquidity management solutions. On September 1, 2017, the Company completed its acquisition of Monitise plc (“Monitise”), a provider of digital solutions that enables innovative digital banking experiences for leading financial institutions worldwide. The Dovetail and Monitise acquisitions are included in the Payments segment and will further enable the Company to help financial institutions around the world transform their payments infrastructure and to expand its digital leadership, respectively.
The Company acquired these four businesses for an aggregate purchase price of $384 million, net of $33 million of acquired cash, along with earn-out provisions estimated at a fair value of $15 million. The purchase price allocations for these acquisitions resulted in acquired software and technology and customer related intangible assets totaling $163 million and goodwill of $217 million. The other net assets of $19 million include $50 million of assets held for sale and approximately $20 million of deferred tax liabilities. The purchase price allocations for the OBS and PCLender acquisitions were finalized in 2017 and did not materially change from the preliminary allocations. The purchase price allocations for the Dovetail and Monitise acquisitions were based on preliminary valuations and are subject to final adjustment. The goodwill from the 2017 acquisitions is primarily attributed to synergies and the anticipated value created by selling the products and services that these businesses provide into the Company’s existing client base. Approximately $70 million of the goodwill is expected to be deductible for tax purposes. The values allocated to intangible assets are as follows:
|
| | | | |
(In millions) | Gross Carrying Amount | Weighted-Average Useful Life |
Customer related intangible assets | $ | 92 |
| 15 years |
Acquired software and technology | 71 |
| 7 years |
| $ | 163 |
| 12 years |
In the first quarter of 2016, the Company acquired the Convenience Pay Services business of Hewlett Packard Enterprise Company and completed its purchase of the Community Financial Services business of ACI Worldwide, Inc. These acquisitions expand the Company’s biller solution offerings and enhance its suite of digital banking and payments solutions, and are included in the Payments segment.
The Company acquired these two businesses for an aggregate purchase price of $265 million. The final purchase price allocations for these acquisitions resulted in technology and customer intangible assets totaling approximately $80 million, goodwill of $173 million, and other identifiable net assets of approximately $12 million consisting primarily of accounts receivable. The goodwill from these transactions is deductible for tax purposes and is primarily attributed to synergies and anticipated revenue and earnings growth associated with the products and services that these businesses provide.
Disposition
On May 11, 2017, the Company sold its Australian item processing business, which was reported within the Financial segment, for approximately $17 million, consisting of $19 million in cash received at closing less a closing adjustment of $2 million finalized in the fourth quarter of 2017. During 2017, the Company recognized a gain on the sale of $10 million, with the related tax expense of $5 million recorded through the income tax provision, in the consolidated statements of income.
3. Discontinued Operations
Income from discontinued operations in 2017 included a litigation settlement related to a prior disposition of $19 million, net of income tax of $7 million, and earnings related to an acquired business held for sale as described below.
On December 18, 2017, a definitive agreement was executed to sell the retail voucher business, MyVoucherCodes, acquired as part of the Company’s acquisition of Monitise in September 2017. The Company completed the sale on January 10, 2018 for proceeds of £37 million ($50 million). The corresponding assets of $50 million, consisting primarily of goodwill, were presented as held for sale in the Company’s consolidated balance sheet at December 31, 2017 and the corresponding earnings during the period were presented within discontinued operations since the business was never considered part of the Company’s ongoing operations.
4. Investment in Unconsolidated Affiliate
The Company owns a 49% interest in StoneRiver Group, L.P. (“StoneRiver”), which is accounted for as an equity method investment. The Company reports its share of StoneRiver’s net income as income from investment in unconsolidated affiliate, with the related tax expense reported within the income tax provision, in the consolidated statements of income. In 2017, 2016 and 2015, the Company received cash dividends, funded from capital transactions, from StoneRiver of $45 million, $151 million and $36 million, respectively. The dividends, in their entirety, represented returns on the Company’s investment and are reported in cash flows from operating activities. The Company’s investment in StoneRiver was $14 million at December 31, 2016 and is reported within other long-term assets in the consolidated balance sheet.
During the first quarter of 2017, StoneRiver recognized a gain on the sale of a business. The Company’s pre-tax share of the gain was $26 million, with related tax expense of $9 million. During 2017, the Company received cash dividends of $45 million from StoneRiver, which were funded from recent sale transactions and recorded as reductions in the Company’s investment in StoneRiver. These dividends exceeded the Company’s investment carrying amount, resulting in the reduction of its investment balance to zero, with the excess cash dividend of $6 million recorded as income, and related tax expense of $2 million, in 2017.
During the first quarter of 2016, StoneRiver recognized a gain on the sale of a business interest in which the Company’s pre-tax share of this gain was $190 million. During the first quarter of 2016, the Company also received cash dividends of $140 million from StoneRiver, which were funded from the sale transaction and recorded as reductions in the Company’s investment in StoneRiver. In conjunction with this activity, the Company evaluated its equity method investment in StoneRiver for its ability to recover the remaining carrying amount of such investment. Utilizing a discounted cash flow analysis (level 3 of the fair value hierarchy) to arrive at a measure of the investment’s fair value, the Company recognized an impairment loss of $44 million. The Company’s pre-tax share of the gain, net of the impairment loss, was $146 million, with related tax expense of $54 million. During 2015, StoneRiver recognized a net gain on the sale of a subsidiary business. The Company’s pre-tax share of the net gain and related expenses was $29 million, with related tax expense of $13 million.
5. Long-Term Debt
The Company’s long-term debt, net of discounts and debt issuance costs, consisted of the following at December 31:
|
| | | | | | | | |
(In millions) | | 2017 | | 2016 |
Revolving credit facility | | $ | 1,068 |
| | $ | 647 |
|
Term loan | | 540 |
| | 629 |
|
2.7% senior notes due 2020 | | 846 |
| | 845 |
|
4.625% senior notes due 2020 | | 449 |
| | 448 |
|
4.75% senior notes due 2021 | | 398 |
| | 398 |
|
3.5% senior notes due 2022 | | 696 |
| | 695 |
|
3.85% senior notes due 2025 | | 894 |
| | 893 |
|
Other borrowings | | 9 |
| | 7 |
|
Total debt | | 4,900 |
| | 4,562 |
|
Less: current maturities | | (3 | ) | | (95 | ) |
Long-term debt | | $ | 4,897 |
| | $ | 4,467 |
|
The estimated fair value of total debt was $5.0 billion and $4.7 billion at December 31, 2017 and 2016, respectively. The Company was in compliance with all financial debt covenants during 2017. Annual maturities of the Company’s total debt were as follows at December 31, 2017:
|
| | | |
(In millions) | |
Year ending December 31, | |
2018 | $ | 3 |
|
2019 | 2 |
|
2020 | 2,905 |
|
2021 | 400 |
|
2022 | 696 |
|
Thereafter | 894 |
|
Total | $ | 4,900 |
|
Revolving Credit Facility
The Company maintains a $2.0 billion revolving credit agreement with a syndicate of banks that matures in April 2020. Borrowings under the revolving credit facility bear interest at a variable rate based on LIBOR or on a base rate, plus a specified margin based on the Company’s long-term debt rating in effect from time to time. The variable interest rate on the revolving credit facility borrowings was 2.59% at December 31, 2017. There are no significant commitment fees and no compensating balance requirements. The revolving credit facility contains various restrictions and covenants that require the Company, among other things, to: (i) limit its consolidated indebtedness as of the end of each fiscal quarter to no more than three and one-half times consolidated net earnings before interest, taxes, depreciation and amortization and certain other adjustments during the period of four fiscal quarters then ended, and (ii) maintain consolidated net earnings before interest, taxes, depreciation and amortization and certain other adjustments of at least three times consolidated interest expense as of the end of each fiscal quarter for the period of four fiscal quarters then ended.
Term Loan
The Company maintains a term loan with a syndicate of banks that matures in October 2018 and bears interest at a variable rate based on LIBOR or on a base rate, plus a specified margin based on the Company’s long-term debt rating in effect from time to time. The variable interest rate on the term loan borrowings was 2.82% at December 31, 2017, and the outstanding principal balance of $540 million is due at maturity. At December 31, 2017, the term loan was classified in the consolidated balance sheet as long-term and within the debt maturity schedule above as maturing in April 2020, the date that the Company’s revolving credit facility expires, as the Company has the intent to refinance this debt on a long-term basis and the ability to do so under its revolving credit facility. The term loan facility contains various restrictions and covenants substantially similar to those contained in the revolving credit facility described above.
Senior Notes
In May 2015, the Company completed an offering of $1.75 billion of senior notes comprised of $850 million aggregate principal amount of 2.7% senior notes due in June 2020 and $900 million aggregate principal amount of 3.85% senior notes due in June 2025. The notes pay interest at the stated rates semi-annually on June 1 and December 1, which commenced on December 1, 2015. The Company’s 4.625% senior notes due in October 2020 and 3.5% senior notes due in October 2022 pay interest at the stated rates on April 1 and October 1 of each year. The Company’s 4.75% senior notes due in June 2021 pay interest at the stated rate on June 15 and December 15 of each year. The interest rates applicable to the senior notes are subject to an increase of up to two percent in the event that the Company’s credit rating is downgraded below investment grade. The indentures governing the senior notes contain covenants that, among other matters, limit (i) the Company’s ability to consolidate or merge into, or convey, transfer or lease all or substantially all of its properties and assets to, another person; (ii) the Company’s and certain of its subsidiaries’ ability to create or assume liens, and (iii) the Company’s and certain of its subsidiaries’ ability to engage in sale and leaseback transactions.
In May 2015, the Company used the net proceeds from the offering described above to redeem its $600 million aggregate principal amount of 3.125% senior notes due in June 2016 and $500 million aggregate principal amount of 6.8% senior notes due in November 2017. The Company recorded a pre-tax loss on early debt extinguishment of $85 million related to make-whole payments and other costs associated with this redemption. In addition, the Company paid scheduled December 2015 and December 2016 principal payments on the term loan totaling $180 million and repaid, at that time, outstanding borrowings under the revolving credit facility. The remaining net proceeds from the offering were used for general corporate purposes.
Debt Issuance Costs
Debt issuance costs are amortized as a component of interest expense over the term of the underlying debt using the effective interest method. Debt issuance costs related to the Company’s term loan and senior notes totaled $14 million and $17 million at December 31, 2017 and 2016, respectively, and are reported as a direct reduction of the related debt instrument in the consolidated balance sheets. Debt issuance costs related to the Company’s revolving credit facility are reported in other long-term assets in the consolidated balance sheets and totaled $3 million and $5 million at December 31, 2017 and 2016, respectively.
6. Income Taxes
Substantially all of the Company’s pre-tax earnings are derived from domestic operations in all periods presented. A reconciliation of the statutory federal income tax rate to the Company’s effective income tax rate for continuing operations is as follows:
|
| | | | | | | | |
| 2017 |
| 2016 |
| 2015 |
Statutory federal income tax rate | 35.0 | % | | 35.0 | % | | 35.0 | % |
State income taxes, net of federal effect | 2.3 | % | | 2.9 | % | | 1.8 | % |
Unconsolidated affiliate tax | 0.9 | % | | 4.2 | % | | 1.1 | % |
Tax benefit due to federal tax reform | (20.3 | )% | | — | % | | — | % |
Excess tax benefit from share-based awards | (3.6 | )% | | — | % | | — | % |
Domestic production activities deduction | (2.0 | )% | | (3.0 | )% | | (2.1 | )% |
Other, net | (0.7 | )% | | (0.5 | )% | | (0.1 | )% |
Effective income tax rate | 11.6 | % | | 38.6 | % | | 35.7 | % |
The income tax provision (benefit) for continuing operations was as follows:
|
| | | | | | | | | | | |
(In millions) | 2017 | | 2016 | | 2015 |
Current: | | | | | |
Federal | $ | 342 |
| | $ | 402 |
| | $ | 315 |
|
State | 44 |
| | 53 |
| | 31 |
|
Foreign | 19 |
| | 16 |
| | 11 |
|
| 405 |
| | 471 |
| | 357 |
|
Deferred: | | | | | |
Federal | (250 | ) | | 21 |
| | 22 |
|
State | 3 |
| | 5 |
| | (2 | ) |
Foreign | — |
| | (5 | ) | | — |
|
| (247 | ) | | 21 |
| | 20 |
|
Income tax provision | $ | 158 |
| | $ | 492 |
| | $ | 377 |
|
Significant components of deferred tax assets and liabilities consisted of the following at December 31:
|
| | | | | | | |
(In millions) | 2017 |
| 2016 |
Accrued expenses | $ | 39 |
| | $ | 48 |
|
Interest rate hedge contracts | 9 |
| | 16 |
|
Share-based compensation | 40 |
| | 57 |
|
Net operating loss and credit carry-forwards | 131 |
| | 85 |
|
Deferred revenue | 17 |
| | 26 |
|
Other | 7 |
| | 15 |
|
Subtotal | 243 |
| | 247 |
|
Valuation allowance | (103 | ) | | (35 | ) |
Total deferred tax assets | 140 |
| | 212 |
|
| | | |
Capitalized software development costs | (117 | ) | | (156 | ) |
Intangible assets | (455 | ) | | (681 | ) |
Property and equipment | (49 | ) | | (67 | ) |
Other | (48 | ) | | (44 | ) |
Total deferred tax liabilities | (669 | ) | | (948 | ) |
Total | $ | (529 | ) | | $ | (736 | ) |
The valuation allowance increased by $68 million, from $35 million at December 31, 2016 to $103 million at December 31, 2017. Of the increase in 2017, $54 million related to net operating losses of newly acquired companies which had no impact on the income tax provision, and $14 million was recorded to the income tax provision.
Deferred tax assets and liabilities are reported in the consolidated balance sheets as follows at December 31:
|
| | | | | | | |
(In millions) | 2017 | | 2016 |
Noncurrent assets | $ | 23 |
| | $ | 26 |
|
Noncurrent liabilities | (552 | ) | | (762 | ) |
Total | $ | (529 | ) | | $ | (736 | ) |
Noncurrent deferred tax assets are included in other long-term assets at December 31, 2017 and 2016.
On December 22, 2017, the U.S. government enacted comprehensive tax legislation commonly referred to as the Tax Cuts and Jobs Act (the “Tax Act”). The Tax Act significantly revised the U.S. corporate income tax code by, among other things, lowering the U.S. federal corporate tax rate from 35 percent to 21 percent beginning in 2018 and requiring companies to pay a one-time transition tax on certain un-repatriated earnings of foreign subsidiaries. The Company has recorded a net tax benefit of $275 million as a result of the Tax Act; however, the Company’s accounting for certain elements of the Tax Act continues to be evaluated. The Company was able to make reasonable estimates of certain effects and has recorded provisional adjustments as follows:
Reduction of U.S. Federal Corporate Tax Rate and Other Provisions – The Tax Act reduces the U.S. federal corporate tax rate to 21 percent, effective January 1, 2018. The Company has recorded a provisional decrease of $270 million to the net deferred tax liability, with a corresponding adjustment to deferred income tax benefit, for the year ended December 31, 2017. While the Company was able to make a reasonable estimate of the impact of the corporate rate reduction, it may be affected by other analyses related to the Tax Act, including, but not limited to, the Company’s calculation of deemed repatriation of deferred foreign income and the state tax effect of adjustments made to federal temporary differences. The Company has also recorded a provisional current income tax benefit of $5 million for the year ended December 31, 2017 related to other provisions of the Tax Act.
Deemed Repatriation Transition Tax – The Deemed Repatriation Transition Tax (“Transition Tax”) is a tax on previously untaxed accumulated and current earnings and profits of certain of our foreign subsidiaries. The Company was able to make a reasonable estimate of the Transition Tax and has recorded zero as its provisional Transition Tax obligation. The Company is continuing to gather additional information to more precisely compute the amount of expense related to the Transition Tax enactment.
The Company was not able to make reasonable estimates, and has not recorded provisional adjustments, for the following elements of the Tax Act. However, the potential impacts would not be material to the Company’s annual income from continuing operations or financial position.
Global Intangible Low-Taxed Income (“GILTI”) – The Tax Act creates a new requirement that certain income, such as GILTI, earned by a controlled foreign corporation must be included in the gross income of its U.S. shareholder. Because of the complexity of the new GILTI tax rules, the Company is not yet able to reasonably estimate the effect of this provision of the Tax Act and is continuing to evaluate this provision of the Tax Act and the application of applicable accounting guidance. Therefore, the Company has not made any adjustments in its consolidated financial statements and has not determined whether to record deferred taxes on GILTI.
Repatriation Intentions and Impacts – The Company is currently analyzing its global working capital and cash requirements and the potential tax liabilities attributable to a repatriation, but has yet to determine whether it plans to change its prior assertion. Accordingly, the Company has not recorded any deferred taxes attributable to investments in foreign subsidiaries for which it is permanently reinvested. The Company will record the tax effects of any change in its prior assertion in the period that it completes its analysis and is able to make a reasonable estimate.
Unrecognized tax benefits were as follows:
|
| | | | | | | | | | | |
(In millions) | 2017 | | 2016 | | 2015 |
Unrecognized tax benefits - Beginning of year | $ | 45 |
| | $ | 54 |
| | $ | 55 |
|
Increases for tax positions taken during the current year | 11 |
| | 9 |
| | 10 |
|
Increases for tax positions taken in prior years | 2 |
| | 1 |
| | — |
|
Decreases for tax positions taken in prior years | (15 | ) | | (15 | ) | | (10 | ) |
Decreases for settlements | (1 | ) | | (2 | ) | | (1 | ) |
Lapse of the statute of limitations | — |
| | (2 | ) | | — |
|
Unrecognized tax benefits - End of year | $ | 42 |
| | $ | 45 |
| | $ | 54 |
|
At December 31, 2017, unrecognized tax benefits of $37 million, net of federal and state benefits, would affect the effective income tax rate from continuing operations if recognized. In 2018, reductions to unrecognized tax benefits for decreases in tax positions taken in prior years, settlements and the lapse of statutes of limitations are estimated to total approximately $10 million. The Company classifies interest expense and penalties related to income taxes as components of its income tax provision. The income tax provision from continuing operations included interest expense and penalties on unrecognized tax benefits of less than $1 million in each of 2017, 2016 and 2015. Accrued interest expense and penalties related to unrecognized tax benefits totaled $3 million and $2 million at December 31, 2017 and 2016, respectively.
The Company’s federal tax returns for 2016 and 2017, and tax returns in certain states and foreign jurisdictions for 2008 through 2017 remain subject to examination by taxing authorities. At December 31, 2017, the Company had federal net operating loss carry-forwards of $36 million, which expire in 2018 through 2037, state net operating loss carry-forwards of $579 million, which expire in 2018 through 2037, and foreign net operating loss carry-forwards of $486 million, $47 million of which expire in 2021 through 2037, and the remainder of which do not expire.
7. Employee Stock and Savings Plans
Stock Plans
The Company recognizes the fair value of share-based compensation awards granted to employees in cost of processing and services, cost of product, and selling, general and administrative expense in its consolidated statements of income.
The Company’s share-based compensation primarily consists of the following:
Stock Options – The Company grants stock options to employees and non-employee directors at exercise prices equal to the fair market value of the Company’s stock on the dates of grant, which are typically in the first quarter of the year. Stock options generally vest over a three-year period beginning on the first anniversary of the grant. All stock options expire ten years from the date of the award. The Company recognizes compensation expense for the fair value of the stock options over the requisite service period of the stock option award.
Restricted Stock Units – The Company awards restricted stock units to employees and non-employee directors. The Company recognizes compensation expense for restricted stock units based on the market price of the common stock on the date of award over the period during which the awards vest. Restricted stock units generally vest over a three-year period beginning on the second anniversary of the award.
Performance Share Units – The Company awards performance share units to employees. The number of shares issued at the end of the performance period is determined by the level of achievement of pre-determined earnings and revenue growth performance goals. The Company recognizes the expense, which is determined by utilizing a probability assessment that the performance goals will be achieved, ratably over the requisite performance period of the award.
Employee Stock Purchase Plan – The Company maintains an employee stock purchase plan that allows eligible employees to purchase a limited number of shares of common stock each quarter through payroll deductions at 85% of the closing price of the Company’s common stock on the last business day of each calendar quarter. The Company recognizes compensation expense related to the 15% discount on the purchase date.
Share-based compensation expense was $63 million in 2017, $68 million in 2016 and $65 million in 2015. Share-based compensation in 2017 and 2016 includes expense recognized on performance share units as management views the performance goals as probable of attainment. The income tax benefits related to share-based compensation totaled $21 million, $23 million and $22 million in 2017, 2016 and 2015, respectively. At December 31, 2017, the total remaining unrecognized compensation cost for unvested stock options, restricted stock units and performance share units, net of estimated forfeitures, of $64 million is expected to be recognized over a weighted-average period of 2.3 years.
The weighted-average estimated fair value of stock options granted during 2017, 2016 and 2015 was $37.53, $31.47 and $25.51 per share, respectively. The fair values of stock options granted were estimated on the date of grant using a binomial option-pricing model with the following assumptions: |
| | | | | | | | |
| 2017 |
| 2016 |
| 2015 |
Expected life (in years) | 6.3 |
| | 6.4 |
| | 6.4 |
|
Average risk-free interest rate | 2.2 | % | | 1.9 | % | | 1.9 | % |
Expected volatility | 28.9 | % | | 29.3 | % | | 29.2 | % |
Expected dividend yield | 0 | % | | 0 | % | | 0 | % |
The Company determined the expected life of stock options using historical data adjusted for known factors that could alter historical exercise behavior. The risk-free interest rate is based on the U.S. treasury yield curve in effect as of the grant date. Expected volatility is determined using weighted-average implied market volatility combined with historical volatility. The Company believes that a blend of historical volatility and implied volatility better reflects future market conditions and better indicates expected volatility than purely historical volatility.
A summary of stock option activity is as follows: |
| | | | | | | | | | | | |
| Shares (In thousands) | | Weighted- Average Exercise Price | | Weighted- Average Remaining Contractual Term (Years) | | Aggregate Intrinsic Value (In millions) |
Stock options outstanding - December 31, 2016 | 7,743 |
| | $ | 48.03 |
| | | | |
Granted | 717 |
| | 114.76 |
| | | | |
Forfeited | (108 | ) | | 95.02 |
| | | | |
Exercised | (1,457 | ) | | 38.07 |
| | | | |
Stock options outstanding - December 31, 2017 | 6,895 |
| | $ | 56.34 |
| | 5.3 | | $ | 516 |
|
Stock options exercisable - December 31, 2017 | 5,249 |
| | $ | 42.38 |
| | 4.3 | | $ | 466 |
|
A summary of restricted stock and performance share unit activity is as follows: |
| | | | | | | | | | | | | | |
| | Restricted Stock Units | | Performance Share Units |
| | Shares (In thousands) | | Weighted- Average Grant Date Fair Value | | Shares
(In thousands) | | Weighted-
Average
Grant Date
Fair Value |
Units - December 31, 2016 | | 1,264 |
| | $ | 66.04 |
| | 149 |
| | $ | 100.66 |
|
Granted | | 333 |
| | 116.70 |
| | 55 |
| | 113.82 |
|
Forfeited | | (92 | ) | | 85.52 |
| | (3 | ) | | 96.65 |
|
Vested | | (534 | ) | | 52.83 |
| | — |
| | — |
|
Units - December 31, 2017 | | 971 |
| | $ | 88.70 |
| | 201 |
| | $ | 104.32 |
|
The table below presents additional information related to stock option and restricted stock unit activity: |
| | | | | | | | | | | | |
(In millions) | | 2017 | | 2016 | | 2015 |
Total intrinsic value of stock options exercised | | $ | 116 |
| | $ | 113 |
| | $ | 123 |
|
Fair value of restricted stock units vested | | 61 |
| | 58 |
| | 41 |
|
Income tax benefit from stock options exercised and restricted stock units vested | | 66 |
| | 62 |
| | 61 |
|
Cash received from stock options exercised | | 36 |
| | 39 |
| | 35 |
|
As of December 31, 2017, 18.5 million share-based awards were available for grant under the Fiserv, Inc. 2007 Omnibus Incentive Plan. Under its employee stock purchase plan, the Company issued 0.4 million shares in 2017 and 0.5 million shares in each of 2016 and 2015. As of December 31, 2017, there were 11.0 million shares available for issuance under the employee stock purchase plan. The number of shares remaining available for future issuance under the employee stock purchase plan is subject to an annual increase on the first day of each fiscal year equal to the lesser of (i) 2.0 million shares, (ii) 1% of the shares of the Company’s common stock outstanding on such date or (iii) a lesser amount determined by the Company’s board of directors.
Employee Savings Plans
The Company and its subsidiaries have defined contribution savings plans covering substantially all employees. Under the plans, eligible participants may elect to contribute a specified percentage of their salaries and the Company makes matching contributions, each subject to certain limitations. Expenses for company contributions under these plans totaled $44 million, $42 million and $40 million in 2017, 2016 and 2015, respectively.
8. Leases, Commitments and Contingencies
Leases
The Company leases certain facilities and equipment under operating leases. Most leases contain renewal options for varying periods. Future minimum rental payments on operating leases with initial non-cancellable lease terms in excess of one year were due as follows at December 31, 2017:
|
| | | |
(In millions) | |
Year ending December 31, | |
2018 | $ | 109 |
|
2019 | 81 |
|
2020 | 52 |
|
2021 | 37 |
|
2022 | 30 |
|
Thereafter | 101 |
|
Total | $ | 410 |
|
Rent expense for all operating leases was $126 million, $117 million and $115 million during 2017, 2016 and 2015, respectively.
Commitments and Contingencies
Litigation
In the normal course of business, the Company or its subsidiaries are named as defendants in lawsuits in which claims are asserted against the Company. In the opinion of management, the liabilities, if any, which may ultimately result from such lawsuits are not expected to have a material adverse effect on the Company’s consolidated financial statements.
Electronic Payments Transactions
In connection with the Company’s processing of electronic payments transactions, funds received from subscribers are invested from the time the Company collects the funds until payments are made to the applicable recipients. These subscriber funds are invested in short-term, highly liquid investments. Subscriber funds, which are not included in the Company’s consolidated balance sheets, can fluctuate significantly based on consumer bill payment and debit card activity and totaled approximately $2.1 billion at December 31, 2017.
Indemnifications and Warranties
Subject to limitations and exclusions, the Company may indemnify its clients from certain costs resulting from claims of patent, copyright or trademark infringement associated with its clients’ use of the Company’s products or services. The Company may also warrant to clients that its products and services will operate substantially in accordance with identified specifications. From time to time, in connection with sales of businesses, the Company agrees to indemnify the buyers for liabilities associated with the businesses that are sold. Payments, net of recoveries, under such indemnification or warranty provisions were not material to the Company’s consolidated results of operations or financial position.
9. Business Segment Information
The Company’s operations are comprised of the Payments segment and the Financial segment. The Payments segment primarily provides electronic bill payment and presentment services, internet and mobile banking software and services, account-to-account transfers, person-to-person payment services, debit and credit card processing and services, payments infrastructure services, and other electronic payments software and services. The businesses in this segment also provide card and print personalization services, investment account processing services for separately managed accounts, and fraud and risk management products and services. The Financial segment provides depository institutions and leasing and finance companies with account processing services, item processing and source capture services, loan origination and servicing products, cash management and consulting services, and other products and services that support numerous types of financial transactions. Corporate and Other primarily consists of unallocated corporate expenses including share-based compensation, amortization of acquisition-related intangible assets, intercompany eliminations and other costs that are not considered when management evaluates segment performance.
|
| | | | | | | | | | | | | | | |
(In millions) | Payments | | Financial | | Corporate and Other | | Total |
2017 | | | | | | | |
Processing and services revenue | $ | 2,476 |
| | $ | 2,347 |
| | $ | 10 |
| | $ | 4,833 |
|
Product revenue | 758 |
| | 183 |
| | (78 | ) | | 863 |
|
Total revenue | 3,234 |
| | 2,530 |
| | (68 | ) | | 5,696 |
|
Operating income | 1,034 |
| | 849 |
| | (351 | ) | | 1,532 |
|
Total assets 1 | 6,596 |
| | 3,309 |
| | 384 |
| | 10,289 |
|
Capital expenditures | 182 |
| | 95 |
| | 10 |
| | 287 |
|
Depreciation and amortization expense | 167 |
| | 83 |
| | 183 |
| | 433 |
|
| | | | | | | |
2016 | | | | | | | |
Processing and services revenue | $ | 2,334 |
| | $ | 2,285 |
| | $ | 6 |
| | $ | 4,625 |
|
Product revenue | 756 |
| | 192 |
| | (68 | ) | | 880 |
|
Total revenue | 3,090 |
| | 2,477 |
| | (62 | ) | | 5,505 |
|
Operating income | 943 |
| | 823 |
| | (321 | ) | | 1,445 |
|
Total assets | 6,143 |
| | 3,287 |
| | 313 |
| | 9,743 |
|
Capital expenditures | 161 |
| | 125 |
| | 4 |
| | 290 |
|
Depreciation and amortization expense | 138 |
| | 89 |
| | 184 |
| | 411 |
|
| | | | | | | |
2015 | | | | | | | |
Processing and services revenue | $ | 2,159 |
| | $ | 2,256 |
| | $ | (4 | ) | | $ | 4,411 |
|
Product revenue | 703 |
| | 187 |
| | (47 | ) | | 843 |
|
Total revenue | 2,862 |
| | 2,443 |
| | (51 | ) | | 5,254 |
|
Operating income | 840 |
| | 826 |
| | (355 | ) | | 1,311 |
|
Total assets | 5,833 |
| | 3,242 |
| | 265 |
| | 9,340 |
|
Capital expenditures | 230 |
| | 119 |
| | 10 |
| | 359 |
|
Depreciation and amortization expense | 119 |
| | 76 |
| | 222 |
| | 417 |
|
1 Assets held for sale of $50 million at December 31, 2017 related to discontinued operations have been included within Corporate and Other.
Revenue from clients outside the United States comprised approximately 5% of total revenue in each of 2017 and 2016 and 6% in 2015.
10. Quarterly Financial Data (unaudited)
Quarterly financial data for 2017 and 2016 was as follows:
|
| | | | | | | | | | | | | | | | | | | |
(In millions, except per share data) | | | | | | | | | |
| First Quarter | | Second Quarter | | Third Quarter | | Fourth Quarter | | Full Year |
2017 | | | | | | | | | |
Total revenue | $ | 1,394 |
| | $ | 1,386 |
| | $ | 1,400 |
| | $ | 1,516 |
| | $ | 5,696 |
|
Cost of processing and services | 570 |
| | 573 |
| | 572 |
| | 576 |
| | 2,291 |
|
Cost of product | 182 |
| | 175 |
| | 174 |
| | 202 |
| | 733 |
|
Selling, general and administrative expenses | 277 |
| | 276 |
| | 284 |
| | 313 |
| | 1,150 |
|
Gain on sale of business | — |
| | (10 | ) | | — |
| | — |
| | (10 | ) |
Total expenses | 1,029 |
| | 1,014 |
| | 1,030 |
| | 1,091 |
| | 4,164 |
|
Operating income | 365 |
| | 372 |
| | 370 |
| | 425 |
| | 1,532 |
|
Income from continuing operations (1) | 247 |
| | 221 |
| | 232 |
| | 532 |
| | 1,232 |
|
Net income (1) | 247 |
| | 221 |
| | 232 |
| | 546 |
| | 1,246 |
|
Comprehensive income | 256 |
| | 229 |
| | 236 |
| | 547 |
| | 1,268 |
|
Net income per share - continuing operations: (2) | | | | | | | | | |
Basic | $ | 1.15 |
| | $ | 1.05 |
| | $ | 1.10 |
| | $ | 2.56 |
| | $ | 5.84 |
|
Diluted | $ | 1.13 |
| | $ | 1.02 |
| | $ | 1.08 |
| | $ | 2.50 |
| | $ | 5.71 |
|
| | | | | | | | | |
2016 | | | | | | | | | |
Total revenue | $ | 1,331 |
| | $ | 1,363 |
| | $ | 1,380 |
| | $ | 1,431 |
| | $ | 5,505 |
|
Cost of processing and services | 553 |
| | 547 |
| | 551 |
| | 561 |
| | 2,212 |
|
Cost of product | 181 |
| | 180 |
| | 186 |
| | 200 |
| | 747 |
|
Selling, general and administrative expenses | 258 |
| | 274 |
| | 274 |
| | 295 |
| | 1,101 |
|
Total expenses | 992 |
| | 1,001 |
| | 1,011 |
| | 1,056 |
| | 4,060 |
|
Operating income | 339 |
| | 362 |
| | 369 |
| | 375 |
| | 1,445 |
|
Income from continuing operations (3) | 289 |
| | 212 |
| | 214 |
| | 215 |
| | 930 |
|
Net income (3) | 289 |
| | 212 |
| | 214 |
| | 215 |
| | 930 |
|
Comprehensive income | 294 |
| | 207 |
| | 219 |
| | 208 |
| | 928 |
|
Net income per share - continuing operations: (2) | | | | | | | | | |
Basic | $ | 1.30 |
| | $ | 0.95 |
| | $ | 0.98 |
| | $ | 0.99 |
| | $ | 4.22 |
|
Diluted | $ | 1.27 |
| | $ | 0.94 |
| | $ | 0.96 |
| | $ | 0.98 |
| | $ | 4.15 |
|
_____
| |
(1) | During the fourth quarter of 2017, the Company recognized discrete income tax benefits of $275 million associated with the Tax Cuts and Jobs Act enacted in December 2017. Refer to Note 6 for more information regarding the Company’s income taxes. |
| |
(2) | Net income per share - continuing operations in each period is calculated using actual, unrounded amounts. |
| |
(3) | During the first quarter of 2016, the Company recognized $146 million associated with its pre-tax share of a net gain on the sale of a business interest by StoneRiver, with related tax expense of $54 million. Refer to Note 4 for more information regarding the Company’s investment in StoneRiver. |
11. Subsequent Events
On February 7, 2018, the Company announced a definitive agreement to sell a 55% interest of its lending solutions business, which is reported within the Financial segment. The Company will retain a 45% interest in the joint venture, which will include all of its automotive loan origination and servicing products, as well as the LoanServ platform. The transaction, which is subject to customary closing conditions, is targeted to close in the first quarter of 2018.
On February 21, 2018, the Company’s board of directors declared a two-for-one stock split of the Company’s common stock and a proportionate increase in the number of its authorized shares of common stock. The additional shares will be distributed on March 19, 2018 to shareholders of record at the close of business on March 5, 2018. The Company's common stock will begin trading at the split-adjusted price on March 20, 2018.
REPORT OF INDEPENDENT REGISTERED PUBLIC ACCOUNTING FIRM
To the Board of Directors and Shareholders of Fiserv, Inc:
Opinion on the Financial Statements
We have audited the accompanying consolidated balance sheets of Fiserv, Inc. and subsidiaries (the "Company") as of December 31, 2017 and 2016, the related consolidated statements of income, comprehensive income, shareholders’ equity, and cash flows, for each of the three years in the period ended December 31, 2017, and the related notes (collectively referred to as the "financial statements"). In our opinion, the financial statements present fairly, in all material respects, the financial position of the Company as of December 31, 2017 and 2016, and the results of its operations and its cash flows for each of the three years in the period ended December 31, 2017, in conformity with accounting principles generally accepted in the United States of America.
We have also audited, in accordance with the standards of the Public Company Accounting Oversight Board (United States) (PCAOB), the Company's internal control over financial reporting as of December 31, 2017, based on criteria established in Internal Control - Integrated Framework (2013) issued by the Committee of Sponsoring Organizations of the Treadway Commission and our report dated February 22, 2018 expressed an unqualified opinion on the Company's internal control over financial reporting.
Basis for Opinion
These financial statements are the responsibility of the Company's management. Our responsibility is to express an opinion on the Company's financial statements based on our audits. We are a public accounting firm registered with the PCAOB and are required to be independent with respect to the Company in accordance with the U.S. federal securities laws and the applicable rules and regulations of the Securities and Exchange Commission and the PCAOB.
We conducted our audits in accordance with the standards of the PCAOB. Those standards require that we plan and perform the audit to obtain reasonable assurance about whether the financial statements are free of material misstatement, whether due to error or fraud. Our audits included performing procedures to assess the risks of material misstatement of the financial statements, whether due to error or fraud, and performing procedures that respond to those risks. Such procedures included examining, on a test basis, evidence regarding the amounts and disclosures in the financial statements. Our audits also included evaluating the accounting principles used and significant estimates made by management, as well as evaluating the overall presentation of the financial statements. We believe that our audits provide a reasonable basis for our opinion.
/s/ Deloitte & Touche LLP
Milwaukee, Wisconsin
February 22, 2018
We have served as the Company’s auditor since 1985.
Item 9. Changes in and Disagreements with Accountants on Accounting and Financial Disclosure
Not applicable.
Item 9A. Controls and Procedures
| |
(a) | Disclosure Controls and Procedures |
Our management, with the participation of our chief executive officer and chief financial officer, evaluated the design and operation of our disclosure controls and procedures (as defined in Rules 13a-15(e) and 15d-15(e) under the Securities Exchange Act of 1934). Based on this evaluation, our chief executive officer and chief financial officer concluded that our disclosure controls and procedures were effective as of December 31, 2017.
| |
(b) | Management Report on Internal Control Over Financial Reporting |
Management’s Annual Report on Internal Control Over Financial Reporting
Our management is responsible for establishing and maintaining adequate internal control over financial reporting, as such term is defined in Rule 13a-15(f) under the Securities Exchange Act of 1934. Our internal control over financial reporting is designed to provide reasonable assurance regarding the reliability of financial reporting and the preparation of financial statements for external purposes in accordance with generally accepted accounting principles.
Because of its inherent limitations, internal control over financial reporting may not prevent or detect misstatements. Also, projections of any evaluation of effectiveness to future periods are subject to risk that controls may become inadequate because of changes in conditions.
Our management assessed the effectiveness of our internal control over financial reporting as of December 31, 2017. In making this assessment, management used the criteria set forth by the Committee of Sponsoring Organizations of the Treadway Commission in Internal Control – Integrated Framework (2013). Based on management’s assessment, our management believes that, as of December 31, 2017, our internal control over financial reporting was effective based on those criteria.
Our independent registered public accounting firm has issued their attestation report on our internal control over financial reporting. The report is included below under the heading “Report of Independent Registered Public Accounting Firm on Internal Control Over Financial Reporting.”
| |
(c) | Changes in Internal Control Over Financial Reporting |
There was no change in our internal control over financial reporting that occurred during the quarter ended December 31, 2017 that has materially affected, or is reasonably likely to materially affect, our internal control over financial reporting.
| |
(d) | Report of Independent Registered Public Accounting Firm on Internal Control Over Financial Reporting |
Our independent registered public accounting firm, Deloitte & Touche LLP, assessed the effectiveness of our internal control over financial reporting and has issued their report as set forth below.
REPORT OF INDEPENDENT REGISTERED PUBLIC ACCOUNTING FIRM
To the Board of Directors and Shareholders of Fiserv, Inc.:
Opinion on Internal Control over Financial Reporting
We have audited the internal control over financial reporting of Fiserv, Inc. and subsidiaries (the “Company”) as of December 31, 2017, based on criteria established in Internal Control - Integrated Framework (2013) issued by the Committee of Sponsoring Organizations of the Treadway Commission (COSO). In our opinion, the Company maintained, in all material respects, effective internal control over financial reporting as of December 31, 2017, based on criteria established in Internal Control - Integrated Framework (2013) issued by COSO.
We have also audited, in accordance with the standards of the Public Company Accounting Oversight Board (United States) (PCAOB), the consolidated financial statements as of and for the year ended December 31, 2017, of the Company and our report dated February 22, 2018, expressed an unqualified opinion on those financial statements.
Basis for Opinion
The Company’s management is responsible for maintaining effective internal control over financial reporting and for its assessment of the effectiveness of internal control over financial reporting, included in the accompanying Management’s Annual Report on Internal Control Over Financial Reporting. Our responsibility is to express an opinion on the Company’s internal control over financial reporting based on our audit. We are a public accounting firm registered with the PCAOB and are required to be independent with respect to the Company in accordance with the U.S. federal securities laws and the applicable rules and regulations of the Securities and Exchange Commission and the PCAOB.
We conducted our audit in accordance with the standards of the PCAOB. Those standards require that we plan and perform the audit to obtain reasonable assurance about whether effective internal control over financial reporting was maintained in all material respects. Our audit included obtaining an understanding of internal control over financial reporting, assessing the risk that a material weakness exists, testing and evaluating the design and operating effectiveness of internal control based on the assessed risk, and performing such other procedures as we considered necessary in the circumstances. We believe that our audit provides a reasonable basis for our opinion
Definition and Limitations of Internal Control over Financial Reporting
A company’s internal control over financial reporting is a process designed to provide reasonable assurance regarding the reliability of financial reporting and the preparation of financial statements for external purposes in accordance with generally accepted accounting principles. A company’s internal control over financial reporting includes those policies and procedures that (1) pertain to the maintenance of records that, in reasonable detail, accurately and fairly reflect the transactions and dispositions of the assets of the company; (2) provide reasonable assurance that transactions are recorded as necessary to permit preparation of financial statements in accordance with generally accepted accounting principles, and that receipts and expenditures of the company are being made only in accordance with authorizations of management and directors of the company; and (3) provide reasonable assurance regarding prevention or timely detection of unauthorized acquisition, use, or disposition of the company’s assets that could have a material effect on the financial statements.
Because of its inherent limitations, internal control over financial reporting may not prevent or detect misstatements. Also, projections of any evaluation of effectiveness to future periods are subject to the risk that controls may become inadequate because of changes in conditions, or that the degree of compliance with the policies or procedures may deteriorate.
/s/ Deloitte & Touche LLP
Milwaukee, Wisconsin
February 22, 2018
Item 9B. Other Information
None.
PART III
Item 10. Directors, Executive Officers and Corporate Governance
Except for information concerning our executive officers included in Part I of this Form 10-K under the caption “Executive Officers of the Registrant,” which is incorporated by reference herein, and the information regarding our Code of Conduct below, the information required by Item 10 is incorporated by reference to the information set forth under the captions “Our Board of Directors,” “Nominees for Election,” “Corporate Governance – Committees of the Board of Directors – Audit Committee,” “Corporate Governance – Nominations of Directors,” and “Section 16(a) Beneficial Ownership Reporting Compliance” in our definitive proxy statement for our 2018 annual meeting of shareholders, which will be filed with the Securities and Exchange Commission no later than 120 days after the close of the fiscal year ended December 31, 2017.
Our board of directors has adopted a Code of Conduct and Business Ethics (“Code of Conduct”) that applies to all of our directors and employees, including our chief executive officer, chief financial officer, chief accounting officer and other persons performing similar functions. We have posted a copy of our Code of Conduct on the “About – For Investors – Corporate Governance – Governance Documents” section of our website at www.fiserv.com. We intend to satisfy the disclosure requirements under Item 5.05 of Form 8-K regarding amendments to, or waivers from, the Code of Conduct by posting such information on the “About – For Investors” section of our website at www.fiserv.com. We are not including the information contained on our website as part of, or incorporating it by reference into, this report.
Item 11. Executive Compensation
The information required by Item 11 is incorporated by reference to the information set forth under the captions “Director Compensation,” “Compensation Discussion and Analysis,” “Compensation Committee Report,” “Compensation Committee Interlocks and Insider Participation,” and “Executive Compensation” in our definitive proxy statement for our 2018 annual meeting of shareholders, which will be filed with the Securities and Exchange Commission no later than 120 days after the close of the fiscal year ended December 31, 2017.
Item 12. Security Ownership of Certain Beneficial Owners and Management and Related Stockholder Matters
The information set forth under the caption “Security Ownership of Certain Beneficial Owners and Management” in our definitive proxy statement for our 2018 annual meeting of shareholders, which will be filed with the Securities and Exchange Commission no later than 120 days after the close of the fiscal year ended December 31, 2017, is incorporated by reference herein.
Equity Compensation Plan Information
The table below sets forth information with respect to compensation plans under which equity securities are authorized for issuance as of December 31, 2017.
|
| | | |
| (a) | (b) | (c) |
Plan Category | Number of shares to be issued upon exercise of outstanding options, warrants and rights | Weighted-average exercise price of outstanding options, warrants and rights | Number of shares remaining available for future issuance under equity compensation plans (excluding securities reflected in column (a)) |
Equity compensation plans approved by our shareholders (1) | 7,162,255 (2) | $56.34 (3) | 18,480,919 (4) |
Equity compensation plans not approved by our shareholders | N/A | N/A | N/A |
Total | 7,162,255 | $56.34 (3) | 18,480,919 |
| |
(1) | Columns (a) and (c) of the table above do not include 904,600 unvested restricted stock units outstanding under the Fiserv, Inc. 2007 Omnibus Incentive Plan (the “Incentive Plan”) or 11,027,712 shares authorized for issuance under the Fiserv, Inc. Amended and Restated Employee Stock Purchase Plan. The number of shares remaining available for future issuance under the employee stock purchase plan is subject to an annual increase on the first day of each fiscal year equal to the lesser of (i) 2,000,000 shares, (ii) 1% of the shares of our common stock outstanding on such date or (iii) a lesser amount determined by our board of directors. |
| |
(2) | Consists of options outstanding under the Incentive Plan as well as 200,839 shares subject to performance share units at the target award level under the Incentive Plan and 66,160 shares subject to non-employee director deferred compensation notional units under the Incentive Plan. |
| |
(3) | Represents the weighted average exercise price of outstanding options and does not take into account outstanding performance share units or non-employee director deferred compensation notional units. |
| |
(4) | Reflects the number of shares available for future issuance under the Incentive Plan. |
Item 13. Certain Relationships and Related Transactions, and Director Independence
The information required by Item 13 is incorporated by reference to the information set forth under the captions “Corporate Governance – Director Independence,” and “Corporate Governance – Review, Approval or Ratification of Transactions with Related Persons,” in our definitive proxy statement for our 2018 annual meeting of shareholders, which will be filed with the Securities and Exchange Commission no later than 120 days after the close of the fiscal year ended December 31, 2017.
Item 14. Principal Accounting Fees and Services
The information required by Item 14 is incorporated by reference to the information set forth under the captions “Independent Registered Public Accounting Firm and Fees” and “Audit Committee Pre-Approval Policy” in our definitive proxy statement for our 2018 annual meeting of shareholders, which will be filed with the Securities and Exchange Commission no later than 120 days after the close of the fiscal year ended December 31, 2017.
PART IV
Item 15. Exhibits, Financial Statement Schedules
Financial Statement Schedules
Financial statement schedules have been omitted because they are not applicable or the required information is shown in the consolidated financial statements or accompanying notes.
Exhibits
The exhibits listed in the accompanying exhibit index are filed as part of this Annual Report on Form 10-K.
EXHIBIT INDEX
|
| | |
Exhibit Number | Exhibit Description |
| 3.1 | |
| 3.2 | |
| 4.1 | |
| 4.2 | |
| 4.3 | |
| 4.4 | |
| 4.5 | |
| 4.6 | |
| 4.7 | |
| 4.8 | |
| 4.9 | |
| | Pursuant to Item 601(b)(4)(iii) of Regulation S-K, the Company agrees to furnish to the Securities and Exchange Commission, upon request, any instrument defining the rights of holders of long-term debt that is not filed as an exhibit to this Form 10-K. |
| 10.1 | |
| | Fiserv, Inc. Amended and Restated 2007 Omnibus Incentive Plan Forms of Award Agreements |
| 10.2 | |
| 10.3 | |
| 10.4 | |
| 10.5 | |
| 10.6 | |
| 10.7 | |
| 10.8 | |
| 10.9 | |
| 10.10 | |
| 10.11 | |
| 10.12 | |
| 10.13 | |
| 10.14 | |
| 10.15 | |
| 10.16 | |
| 10.17 | |
| 10.18 | |
| 10.19 | |
| 10.20 | |
| 10.21 | |
|
| | |
| 10.22 | |
| 10.23 | |
| 10.24 | |
| 10.25 | |
| 10.26 | |
| 10.27 | |
| 10.28 | |
| 10.29 | |
| 10.30 | |
| 10.31 | |
| 10.32 | |
| 10.33 | |
| 10.34 | |
| 10.35 | |
| 10.36 | |
| 10.37 | |
| 10.38 | |
| 21.1 | |
| 23.1 | |
| 31.1 | |
| 31.2 | |
| 32.1 | |
| 101.INS** | XBRL Instance Document |
| 101.SCH** | XBRL Taxonomy Extension Schema Document |
| 101.CAL** | XBRL Taxonomy Extension Calculation Linkbase Document |
| 101.DEF** | XBRL Taxonomy Extension Definition Linkbase Document |
| 101.LAB** | XBRL Taxonomy Extension Label Linkbase Document |
| 101.PRE** | XBRL Taxonomy Extension Presentation Linkbase Document |
_____
* This exhibit is a management contract or compensatory plan or arrangement.
| |
** | Filed with this Annual Report on Form 10-K are the following documents formatted in XBRL (Extensible Business Reporting Language): (i) the Consolidated Statements of Income for the years ended December 31, 2017, 2016, and 2015, (ii) the Consolidated Statements of Comprehensive Income for the years ended December 31, 2017, 2016, and 2015, (iii) the Consolidated Balance Sheets at December 31, 2017 and 2016, (iv) the Consolidated Statements of Shareholders’ Equity for the years ended December 31, 2017, 2016, and 2015, (v) the Consolidated Statements of Cash Flows for the years ended December 31, 2017, 2016, and 2015, and (vi) Notes to Consolidated Financial Statements. |
| |
(1) | Previously filed as an exhibit to the Company’s Current Report on Form 8-K filed on December 3, 2013, and incorporated herein by reference. |
| |
(2) | Previously filed as an exhibit to the Company’s Annual Report on Form 10-K filed on February 19, 2016, and incorporated herein by reference. |
| |
(3) | Previously filed as an exhibit to the Company’s Current Report on Form 8-K filed on May 5, 2015, and incorporated herein by reference. |
| |
(4) | Previously filed as an exhibit to the Company’s Current Report on Form 8-K filed on October 29, 2013, and incorporated herein by reference. |
| |
(5) | Previously filed as an exhibit to the Company’s Registration Statement on Form S-3 (File No. 333‑147309) filed on November 13, 2007, and incorporated herein by reference. |
| |
(6) | Previously filed as an exhibit to the Company’s Current Report on Form 8-K filed on September 21, 2010, and incorporated herein by reference. |
| |
(7) | Previously filed as an exhibit to the Company’s Current Report on Form 8-K filed on June 14, 2011, and incorporated herein by reference. |
| |
(8) | Previously filed as an exhibit to the Company’s Current Report on Form 8-K filed on September 25, 2012, and incorporated herein by reference. |
| |
(9) | Previously filed as an exhibit to the Company’s Current Report on Form 8-K filed on May 22, 2015, and incorporated herein by reference. |
| |
(10) | Previously filed as an exhibit to the Company’s Annual Report on Form 10-K filed on February 24, 2012, and incorporated herein by reference. |
| |
(11) | Previously filed as an exhibit to the Company’s Annual Report on Form 10-K filed on February 23, 2017, and incorporated herein by reference. |
| |
(12) | Previously filed as an exhibit to the Company’s Annual Report on Form 10-K filed on February 20, 2015, and incorporated herein by reference. |
| |
(13) | Previously filed as an exhibit to the Company’s Quarterly Report on Form 10-Q filed on August 2, 2017, and incorporated herein by reference. |
| |
(14) | Previously filed as an exhibit to the Company’s Current Report on Form 8-K filed on December 1, 2017, and incorporated herein by reference. |
| |
(15) | Previously filed as an exhibit to the Company’s Current Report on Form 8-K filed on December 23, 2008, and incorporated herein by reference. |
| |
(16) | Previously filed as an exhibit to the Company’s Annual Report on Form 10-K filed on February 27, 2009, and incorporated herein by reference. |
| |
(17) | Previously filed as an exhibit to the Company’s Current Report on Form 8-K filed on December 30, 2009, and incorporated herein by reference. |
| |
(18) | Previously filed as an exhibit to the Company’s Current Report on Form 8-K filed on April 1, 2016, and incorporated herein by reference. |
| |
(19) | Previously filed as an exhibit to the Company’s Current Report on Form 8-K filed on May 27, 2011, and incorporated herein by reference. |
| |
(20) | Previously filed as an exhibit to the Company’s Quarterly Report on Form 10-Q filed on October 30, 2013, and incorporated herein by reference. |
| |
(21) | Previously filed as an exhibit to the Company’s Annual Report on Form 10-K filed on February 20, 2014, and incorporated herein by reference. |
| |
(22) | Previously filed as an exhibit to the Company’s Current Report on Form 8-K filed on February 16, 2016, and incorporated herein by reference. |
| |
(23) | Previously filed as an exhibit to the Company’s Quarterly Report on Form 10-Q filed on May 6, 2016, and incorporated herein by reference. |
| |
(24) | Previously filed as an exhibit to the Company’s Annual Report on Form 10-K filed on February 28, 2008, and incorporated herein by reference. |
| |
(25) | Previously filed as an exhibit to the Company’s Quarterly Report on Form 10-Q filed on July 30, 2015, and incorporated herein by reference. |
Item 16. Form 10-K Summary
None.
SIGNATURES
Pursuant to the requirements of Section 13 or 15(d) of the Securities Exchange Act of 1934, the registrant has duly caused this report to be signed on its behalf by the undersigned, thereunto duly authorized on February 22, 2018.
|
| | |
| FISERV, INC. |
| | |
| By: | /s/ Jeffery W. Yabuki |
| | Jeffery W. Yabuki |
| | President and Chief Executive Officer |
Pursuant to the requirements of the Securities Exchange Act of 1934, this report has been signed below by the following persons on behalf of the registrant and in the capacities indicated on February 22, 2018.
|
| | |
Name | | Capacity |
| | |
/s/ Glenn M. Renwick | | Chairman of the Board |
Glenn M. Renwick | | |
| | |
/s/ Jeffery W. Yabuki | | Director, President and Chief Executive Officer (Principal Executive Officer) |
Jeffery W. Yabuki | |
| | |
/s/ Robert W. Hau | | Chief Financial Officer and Treasurer (Principal Financial Officer) |
Robert W. Hau | |
| | |
/s/ Kenneth F. Best | | Chief Accounting Officer (Principal Accounting Officer) |
Kenneth F. Best | |
| | |
/s/ Alison Davis | | Director |
Alison Davis | | |
| | |
| | Director |
Harry F. DiSimone | | |
| | |
/s/ John Y. Kim | | Director |
John Y. Kim | | |
| | |
/s/ Dennis F. Lynch | | Director |
Dennis F. Lynch | | |
| | |
/s/ Denis J. O’Leary | | Director |
Denis J. O’Leary | | |
| | |
/s/ Kim M. Robak | | Director |
Kim M. Robak | | |
| | |
/s/ JD Sherman | | Director |
JD Sherman | | |
| | |
/s/ Doyle R. Simons | | Director |
Doyle R. Simons | | |
| | |